 6
6peptides
spectra
0.077 | 0.207
0.000 | 0.000
0.000 | 0.105
0.045 | 0.197
0.000 | 0.022
0.374 | 0.562
0.000 | 0.060
0.137 | 0.215
3peptides
spectra
0.000 | 0.000
1.000 | 1.000
| Plot | Mito | Lyso | Perox | ER | Golgi | PM | Cytosol | Nucleus | |||||
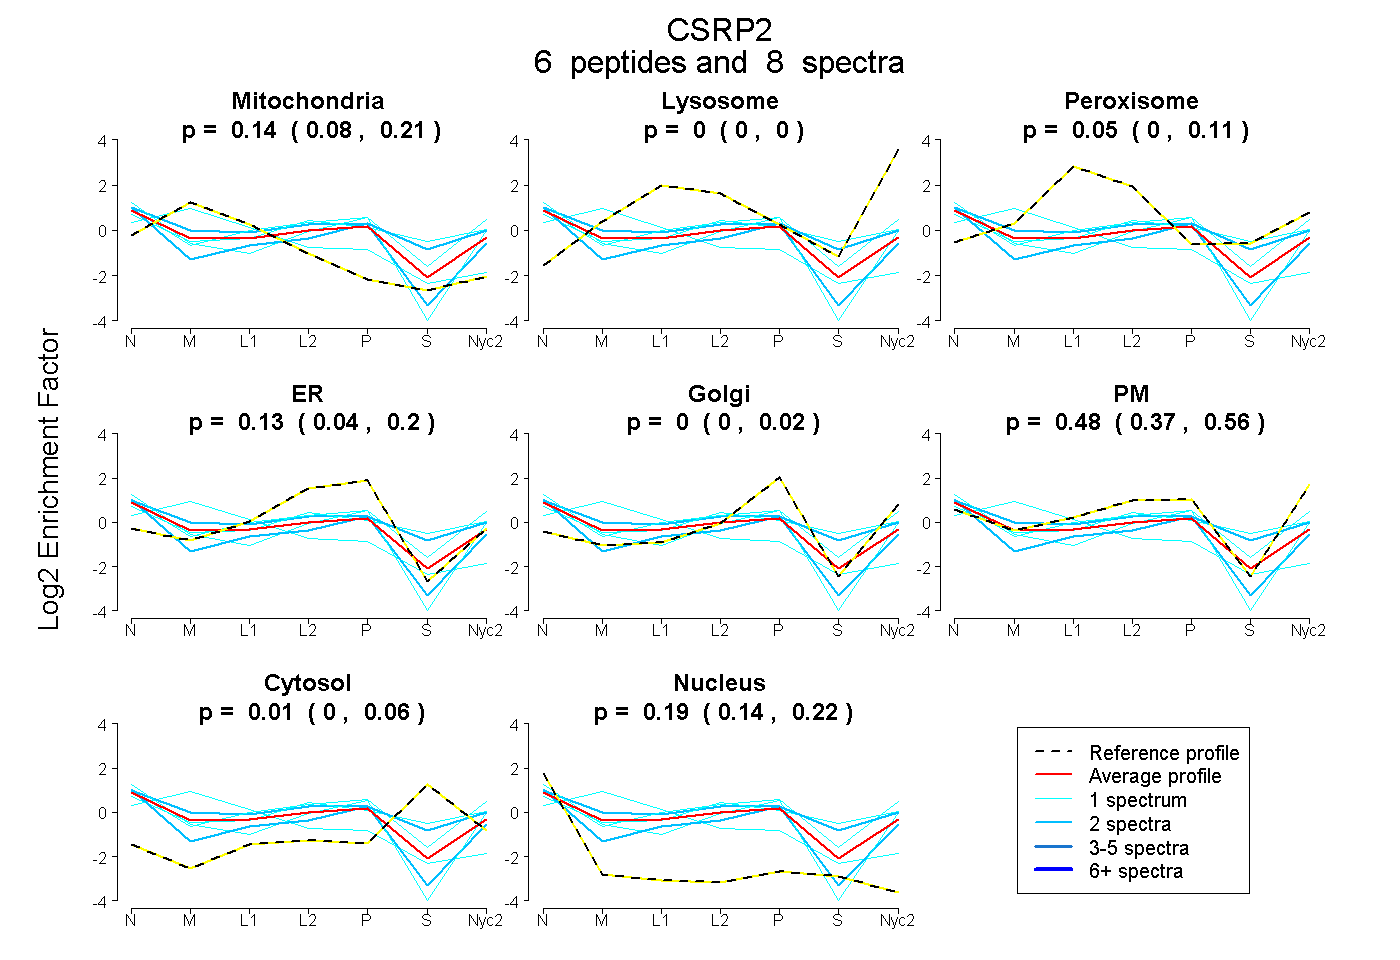
| Expt A |
6 peptides |
8 spectra |
|
0.142 0.077 | 0.207 |
0.000 0.000 | 0.000 |
0.053 0.000 | 0.105 |
0.129 0.045 | 0.197 |
0.000 0.000 | 0.022 |
0.483 0.374 | 0.562 |
0.007 0.000 | 0.060 |
0.186 0.137 | 0.215 |
||
| Plot | Lyso | Other | |||||||||||
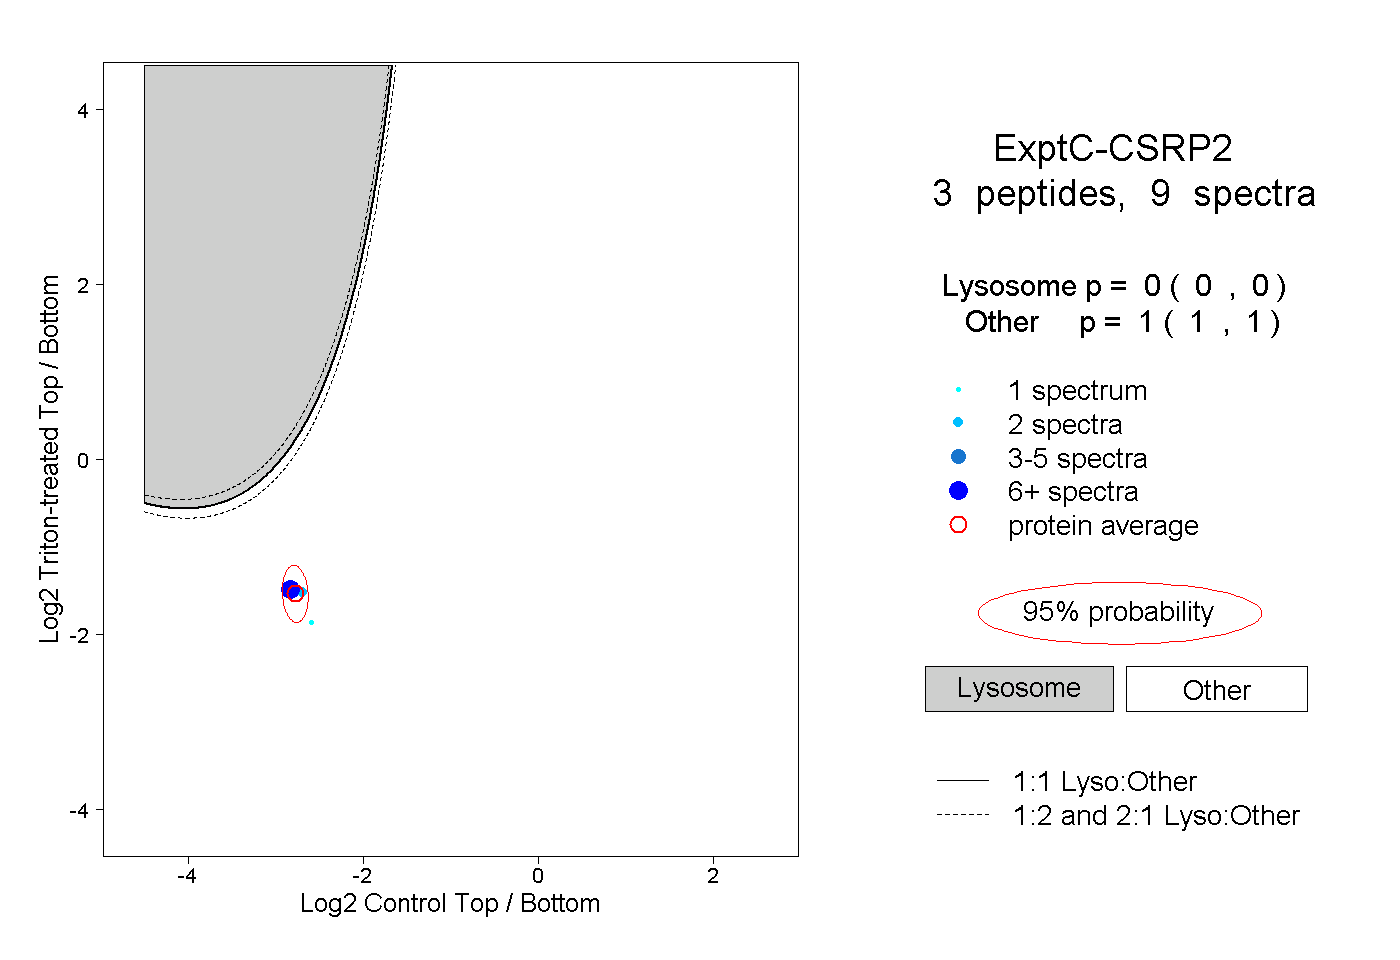
| Expt C |
3 peptides |
9 spectra |
|
0.000 0.000 | 0.000 |
1.000 1.000 | 1.000 |