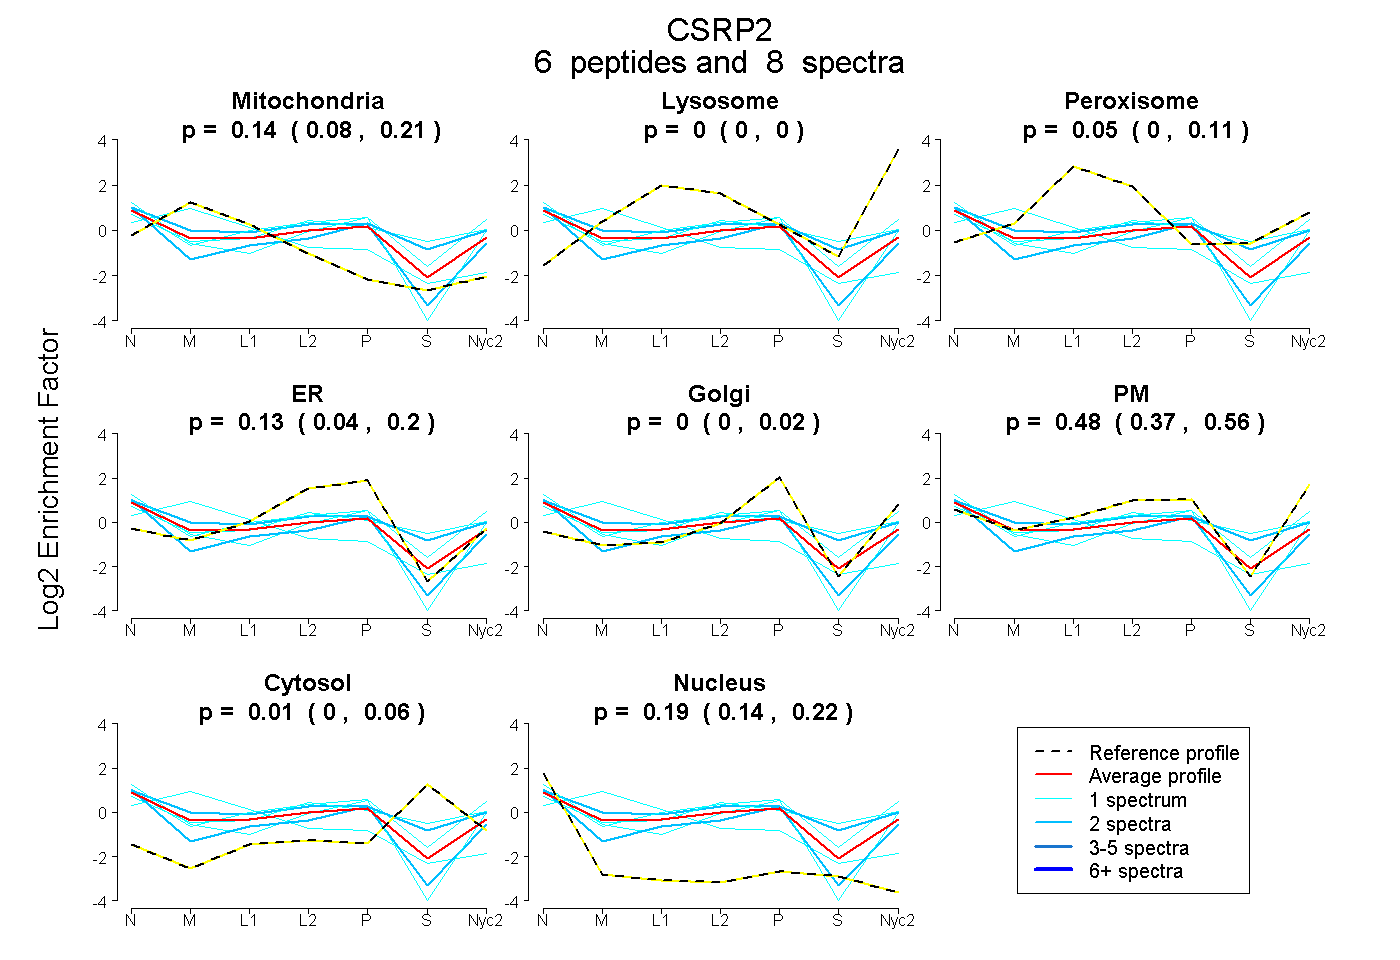
 6
6peptides
spectra
0.077 | 0.207
0.000 | 0.000
0.000 | 0.105
0.045 | 0.197
0.000 | 0.022
0.374 | 0.562
0.000 | 0.060
0.137 | 0.215
| Plot | Mito | Lyso | Perox | ER | Golgi | PM | Cytosol | Nucleus | |||||
| Expt A |
6 peptides |
8 spectra |
|
0.142 0.077 | 0.207 |
0.000 0.000 | 0.000 |
0.053 0.000 | 0.105 |
0.129 0.045 | 0.197 |
0.000 0.000 | 0.022 |
0.483 0.374 | 0.562 |
0.007 0.000 | 0.060 |
0.186 0.137 | 0.215 |
| 1 spectrum, CCFLCMVCR | 0.730 | 0.000 | 0.000 | 0.193 | 0.040 | 0.002 | 0.000 | 0.035 | ||
| 1 spectrum, IIGAGKPWHK | 0.000 | 0.000 | 0.000 | 0.141 | 0.000 | 0.597 | 0.000 | 0.262 | ||
| 2 spectra, EGEIYCK | 0.256 | 0.000 | 0.000 | 0.263 | 0.000 | 0.372 | 0.000 | 0.109 | ||
| 1 spectrum, GFGYGQGAGALVHAQ | 0.000 | 0.000 | 0.114 | 0.023 | 0.000 | 0.661 | 0.070 | 0.132 | ||
| 1 spectrum, TVYHAEEVQCDGR | 0.000 | 0.000 | 0.182 | 0.032 | 0.000 | 0.439 | 0.257 | 0.090 | ||
| 2 spectra, YGGAEK | 0.000 | 0.000 | 0.000 | 0.000 | 0.000 | 0.569 | 0.282 | 0.149 |
| Plot | Lyso | Other | |||||||||||
| Expt C |
3 peptides |
9 spectra |
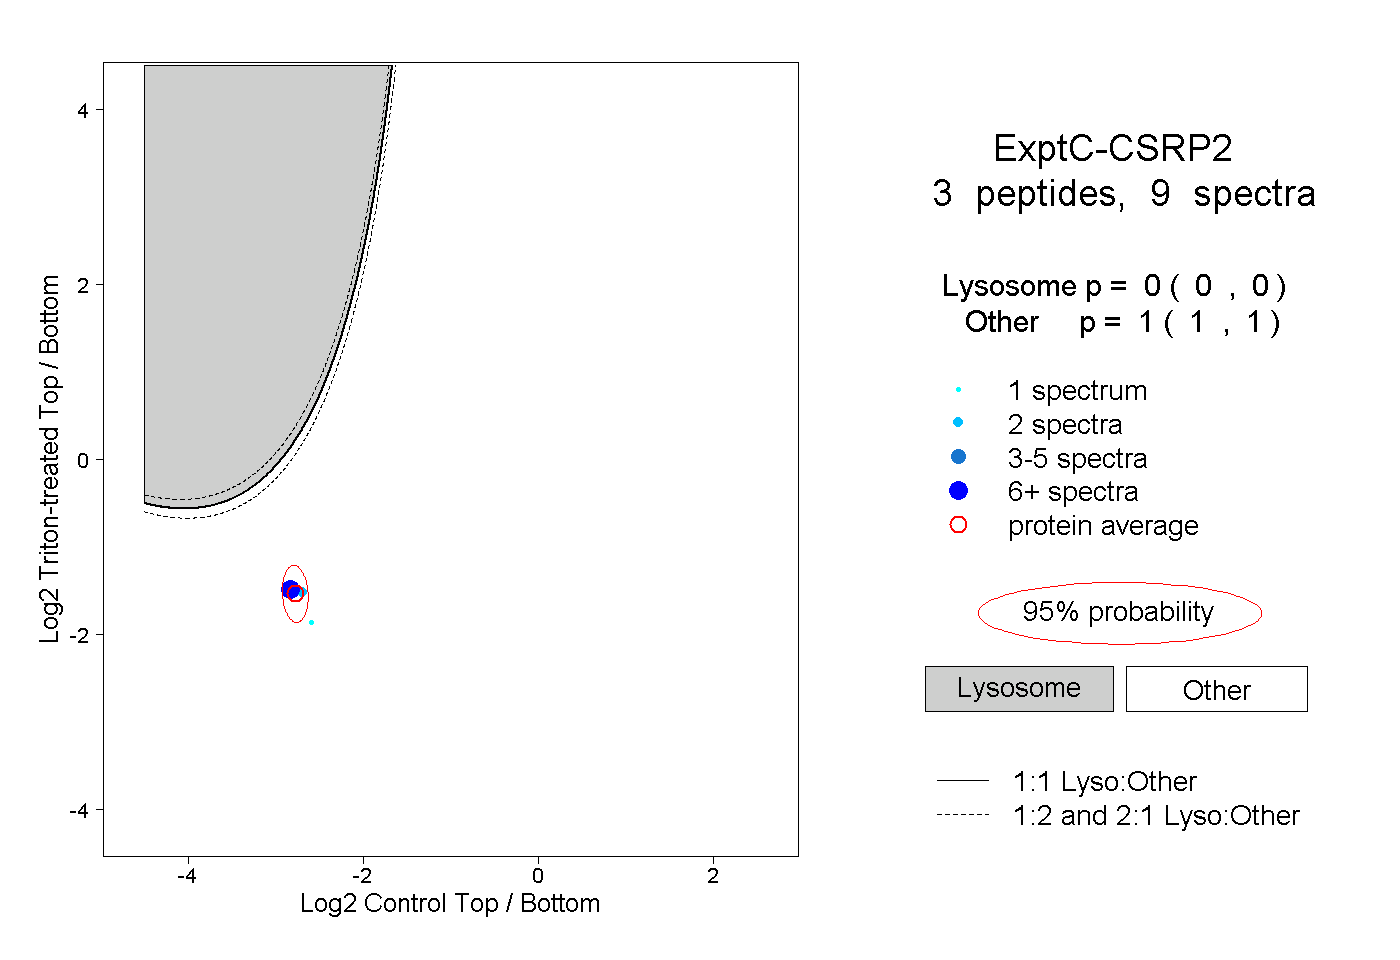 |
0.000 0.000 | 0.000 |
1.000 1.000 | 1.000 |