 7
7peptides
spectra
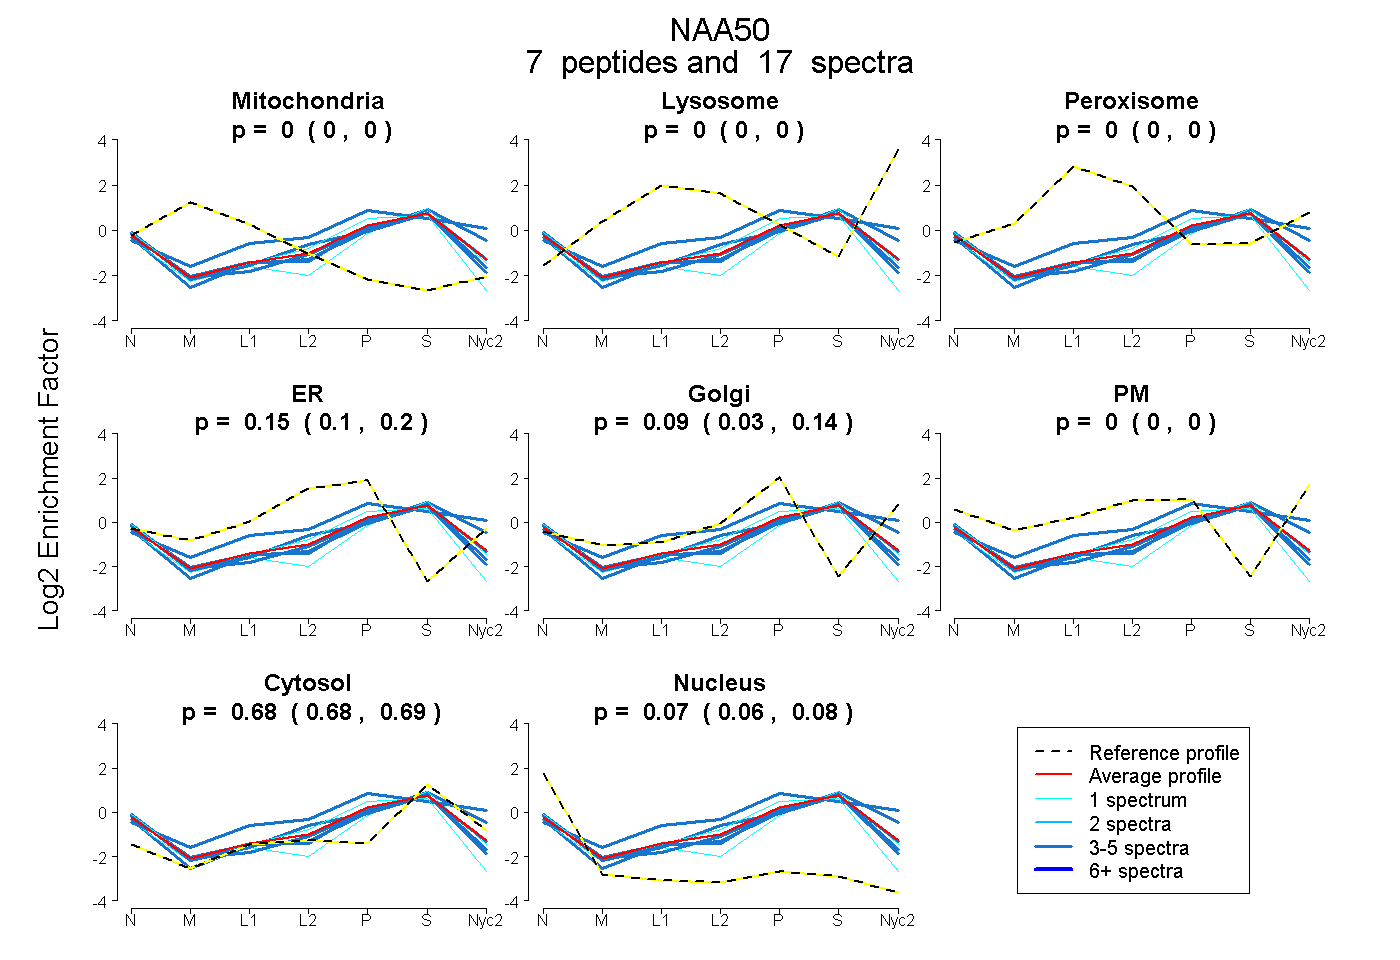
0.000 | 0.000
0.000 | 0.000
0.000 | 0.000
0.102 | 0.198
0.031 | 0.143
0.000 | 0.000
0.676 | 0.690
0.056 | 0.081
3peptides
spectra
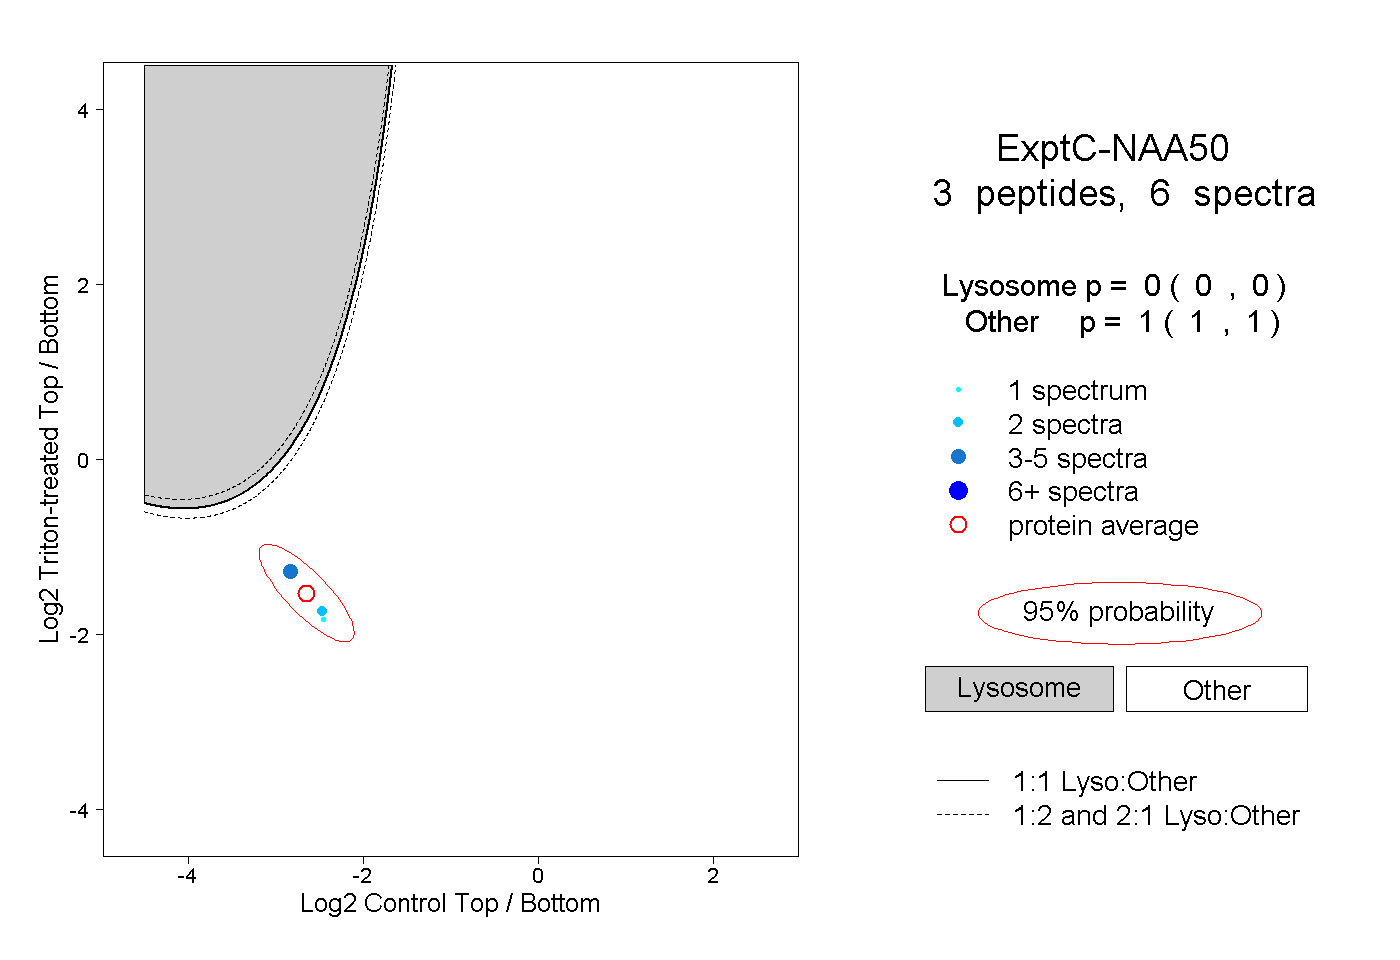
0.000 | 0.000
1.000 | 1.000
1peptide
spectra
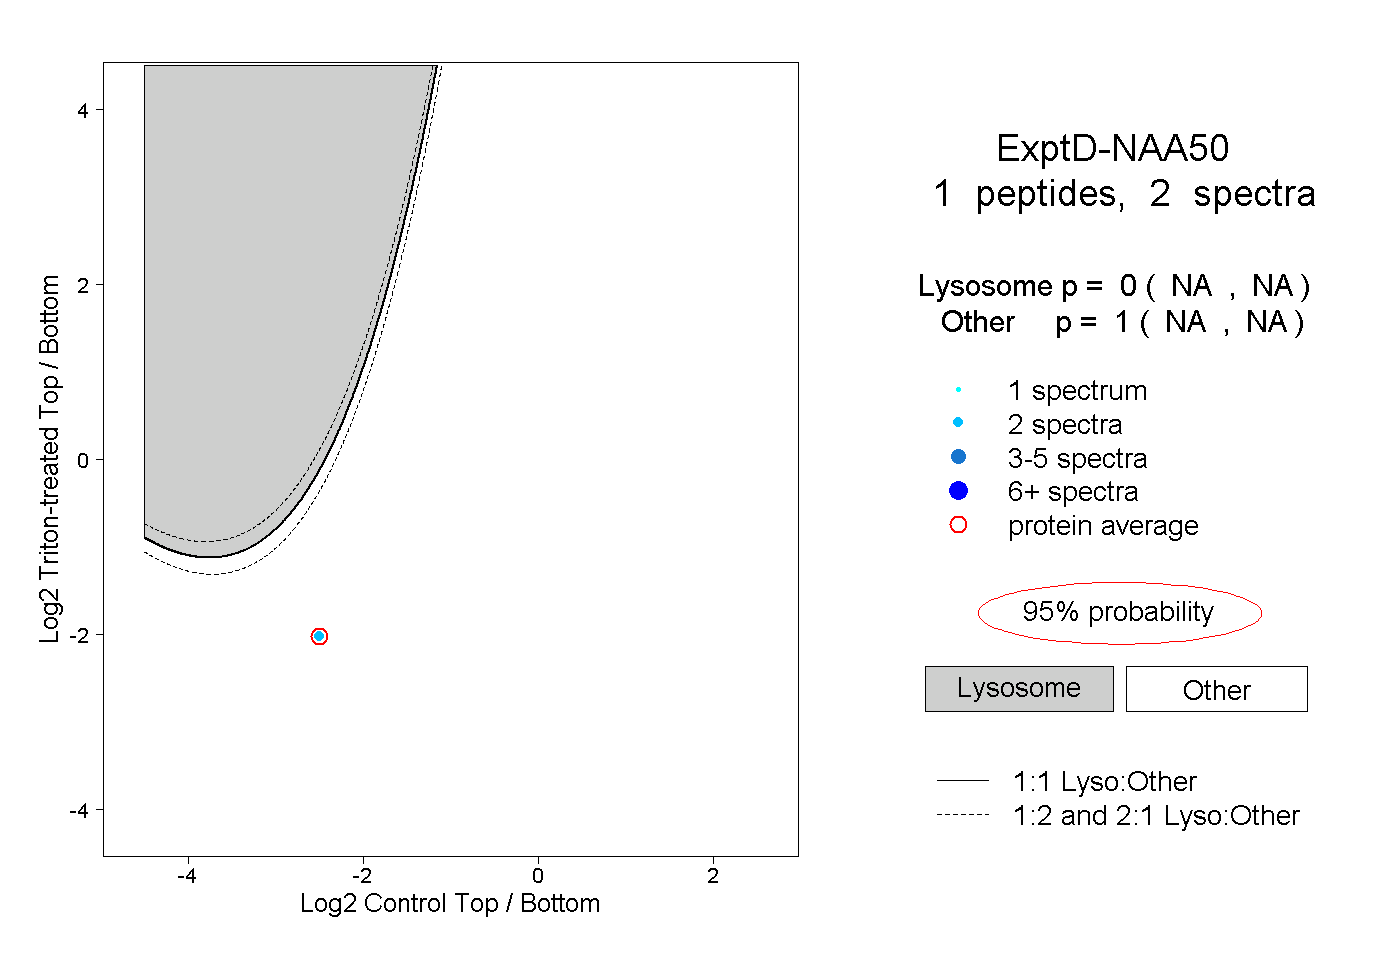
NA | NA
NA | NA