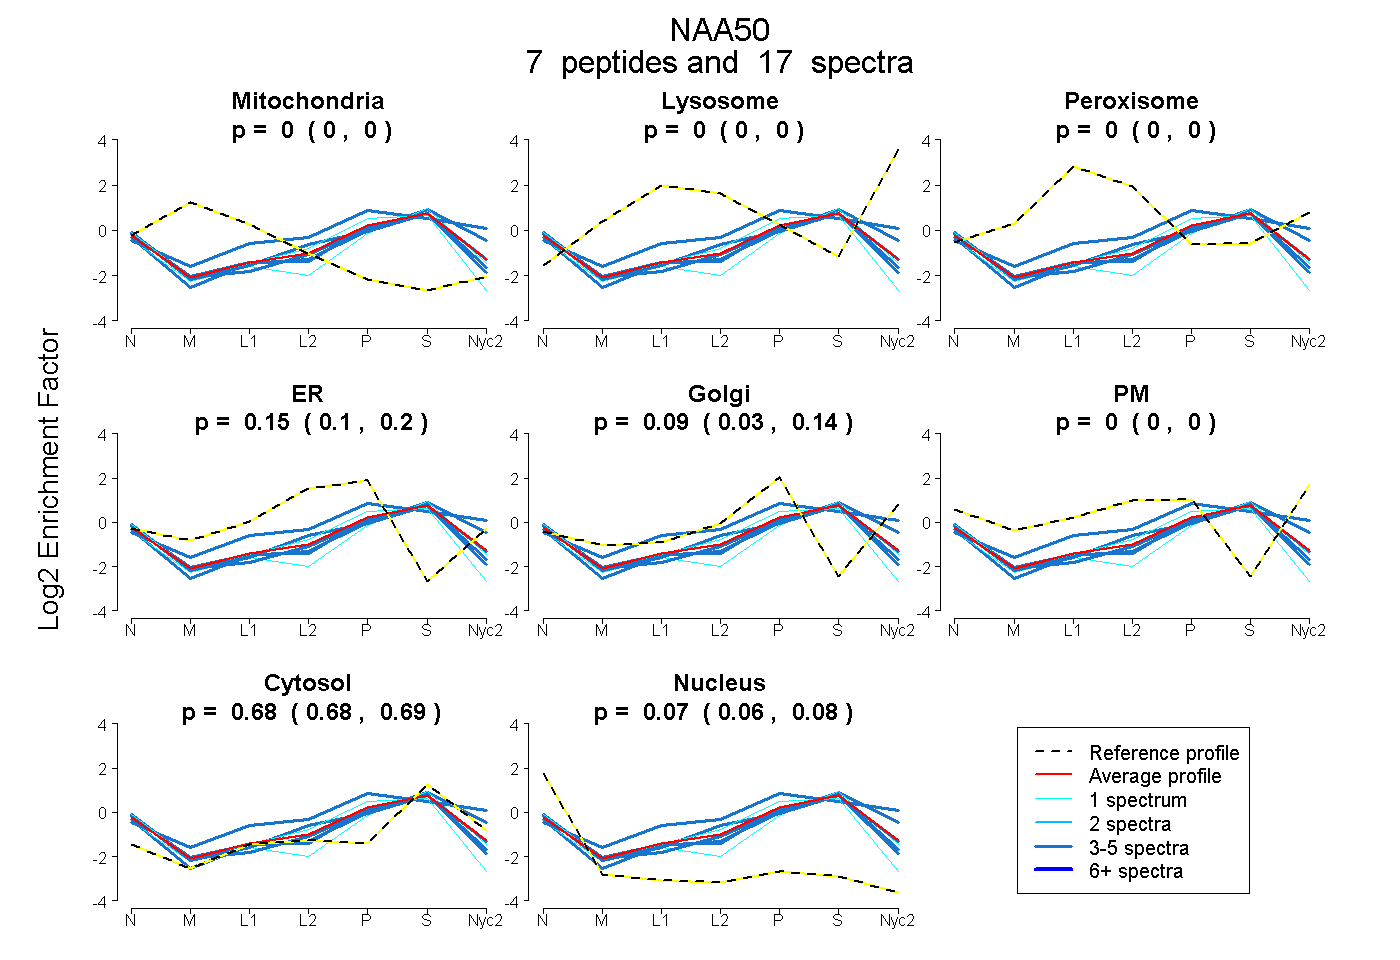
 7
7peptides
spectra
0.000 | 0.000
0.000 | 0.000
0.000 | 0.000
0.102 | 0.198
0.031 | 0.143
0.000 | 0.000
0.676 | 0.690
0.056 | 0.081
| Plot | Mito | Lyso | Perox | ER | Golgi | PM | Cytosol | Nucleus | |||||
| Expt A |
7 peptides |
17 spectra |
|
0.000 0.000 | 0.000 |
0.000 0.000 | 0.000 |
0.000 0.000 | 0.000 |
0.153 0.102 | 0.198 |
0.093 0.031 | 0.143 |
0.000 0.000 | 0.000 |
0.683 0.676 | 0.690 |
0.070 0.056 | 0.081 |
| 3 spectra, VDHSQNQK | 0.000 | 0.000 | 0.000 | 0.224 | 0.000 | 0.000 | 0.676 | 0.101 | ||
| 3 spectra, IELGDVTPHNIK | 0.000 | 0.000 | 0.000 | 0.033 | 0.199 | 0.000 | 0.674 | 0.093 | ||
| 3 spectra, IEPADAHVLQK | 0.000 | 0.000 | 0.000 | 0.186 | 0.000 | 0.000 | 0.665 | 0.149 | ||
| 1 spectrum, FGFEIIETK | 0.000 | 0.000 | 0.000 | 0.000 | 0.127 | 0.000 | 0.748 | 0.126 | ||
| 3 spectra, MLNHVLNICEK | 0.000 | 0.000 | 0.126 | 0.000 | 0.395 | 0.000 | 0.478 | 0.000 | ||
| 1 spectrum, VPSGQSAETQK | 0.000 | 0.000 | 0.000 | 0.253 | 0.000 | 0.000 | 0.585 | 0.162 | ||
| 3 spectra, DVLEVGELAK | 0.000 | 0.000 | 0.000 | 0.000 | 0.229 | 0.000 | 0.750 | 0.021 |
| Plot | Lyso | Other | |||||||||||
| Expt C |
3 peptides |
6 spectra |
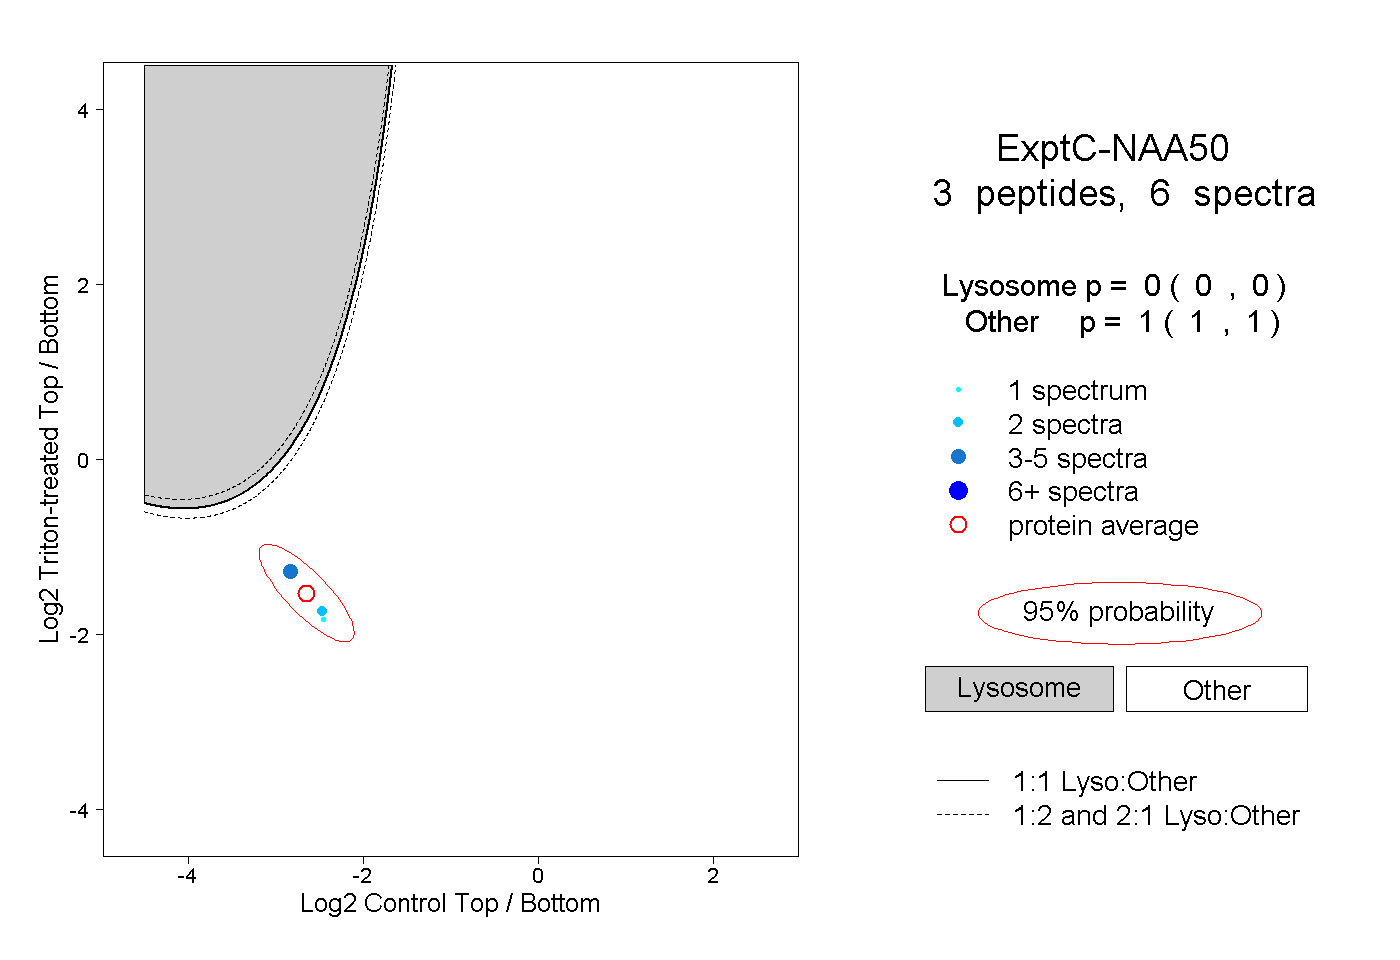 |
0.000 0.000 | 0.000 |
1.000 1.000 | 1.000 |
||||||||
| Plot | Lyso | Other | |||||||||||
| Expt D |
1 peptide |
2 spectra |
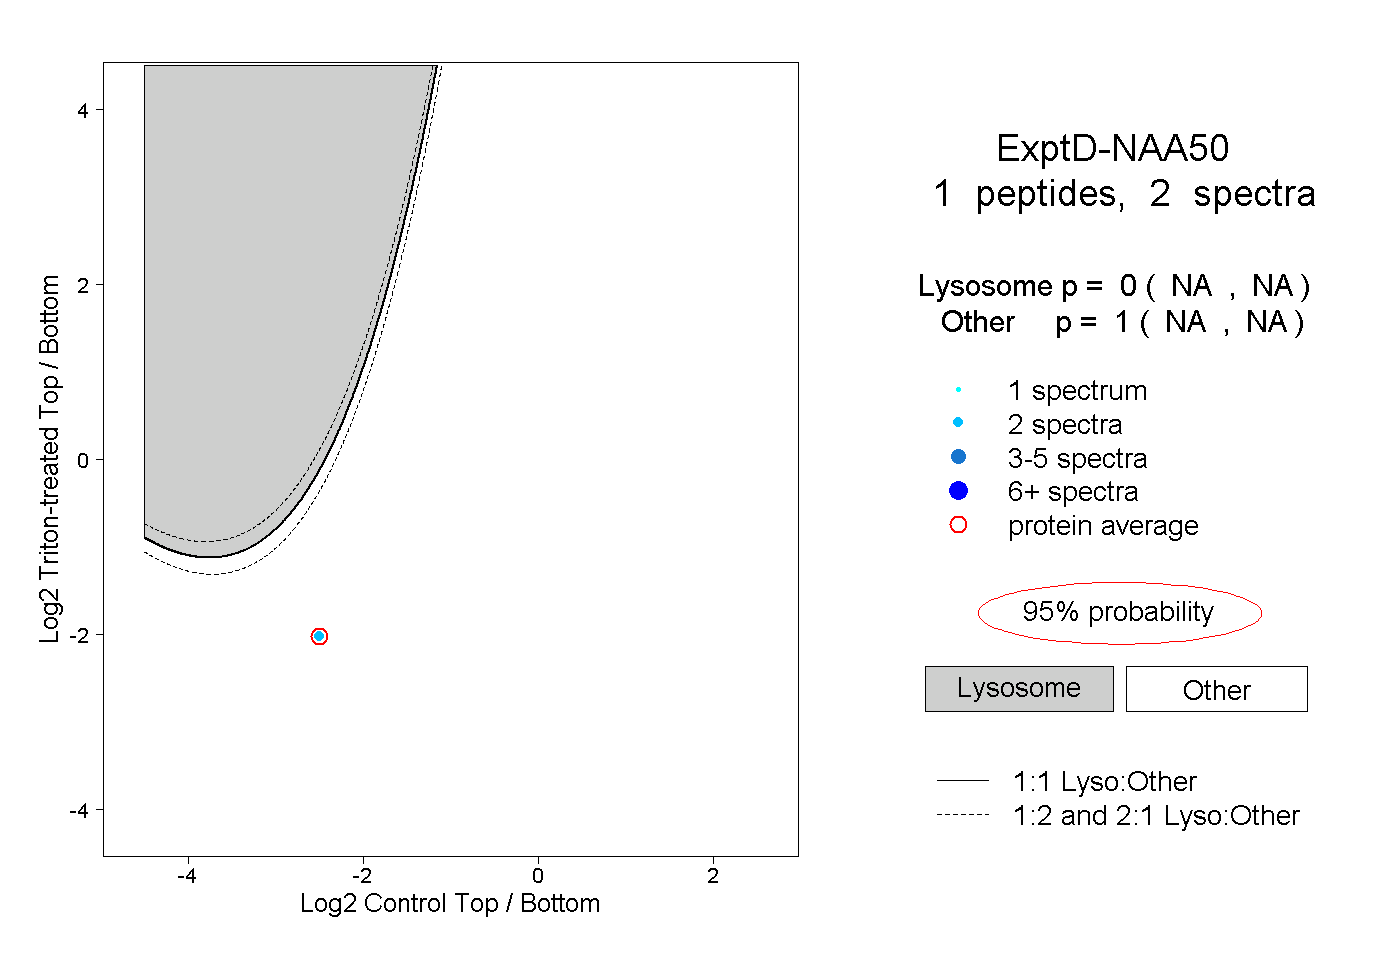 |
0.000 NA | NA |
1.000 NA | NA |