 5
5peptides
spectra
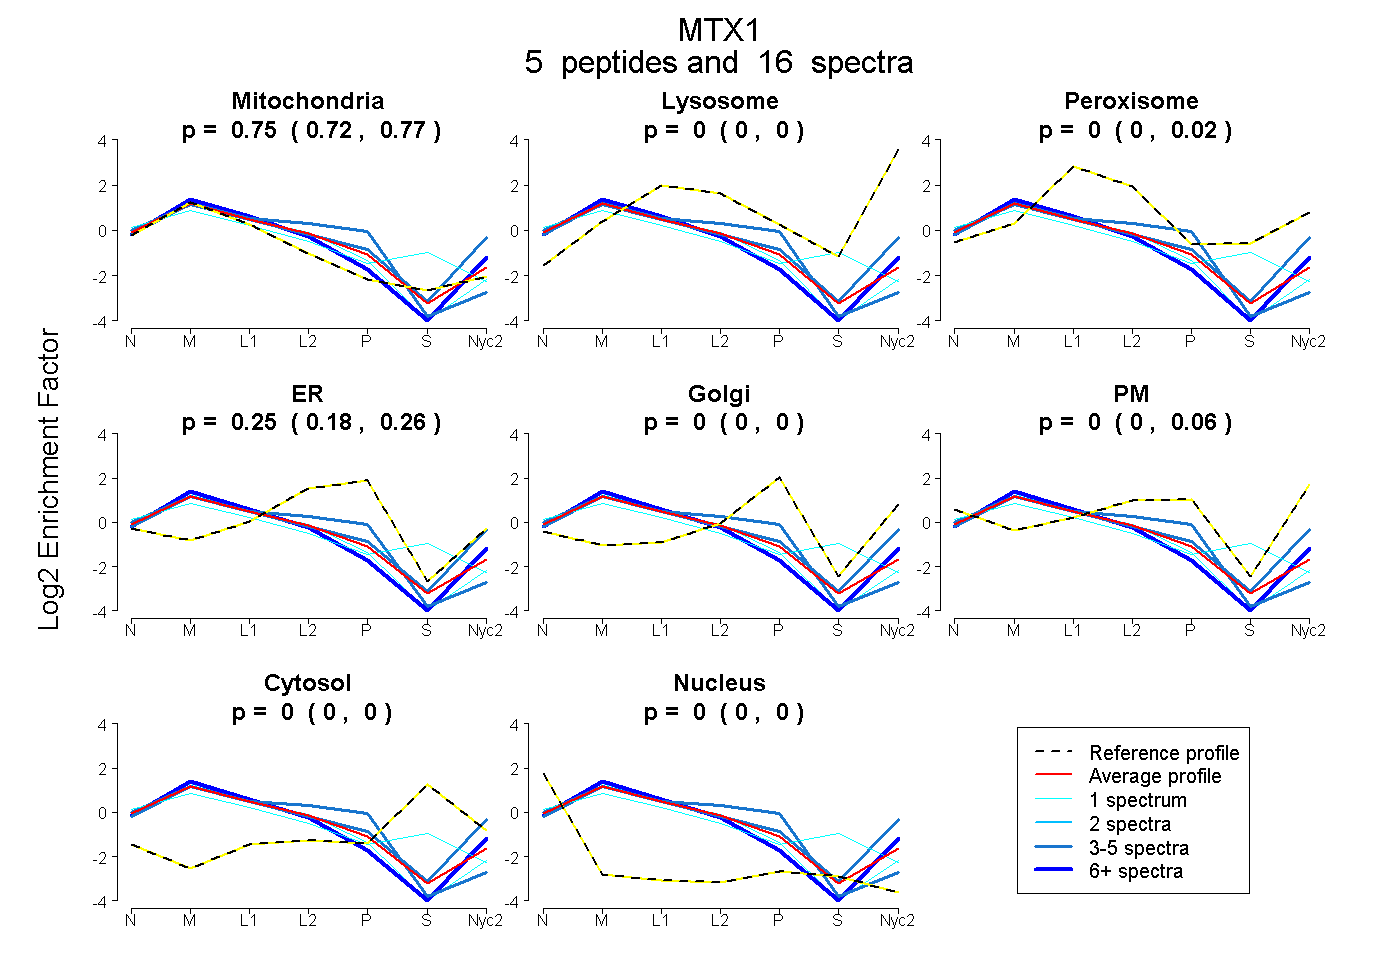
0.723 | 0.771
0.000 | 0.000
0.000 | 0.017
0.182 | 0.262
0.000 | 0.000
0.000 | 0.056
0.000 | 0.000
0.000 | 0.000
5peptides
spectra
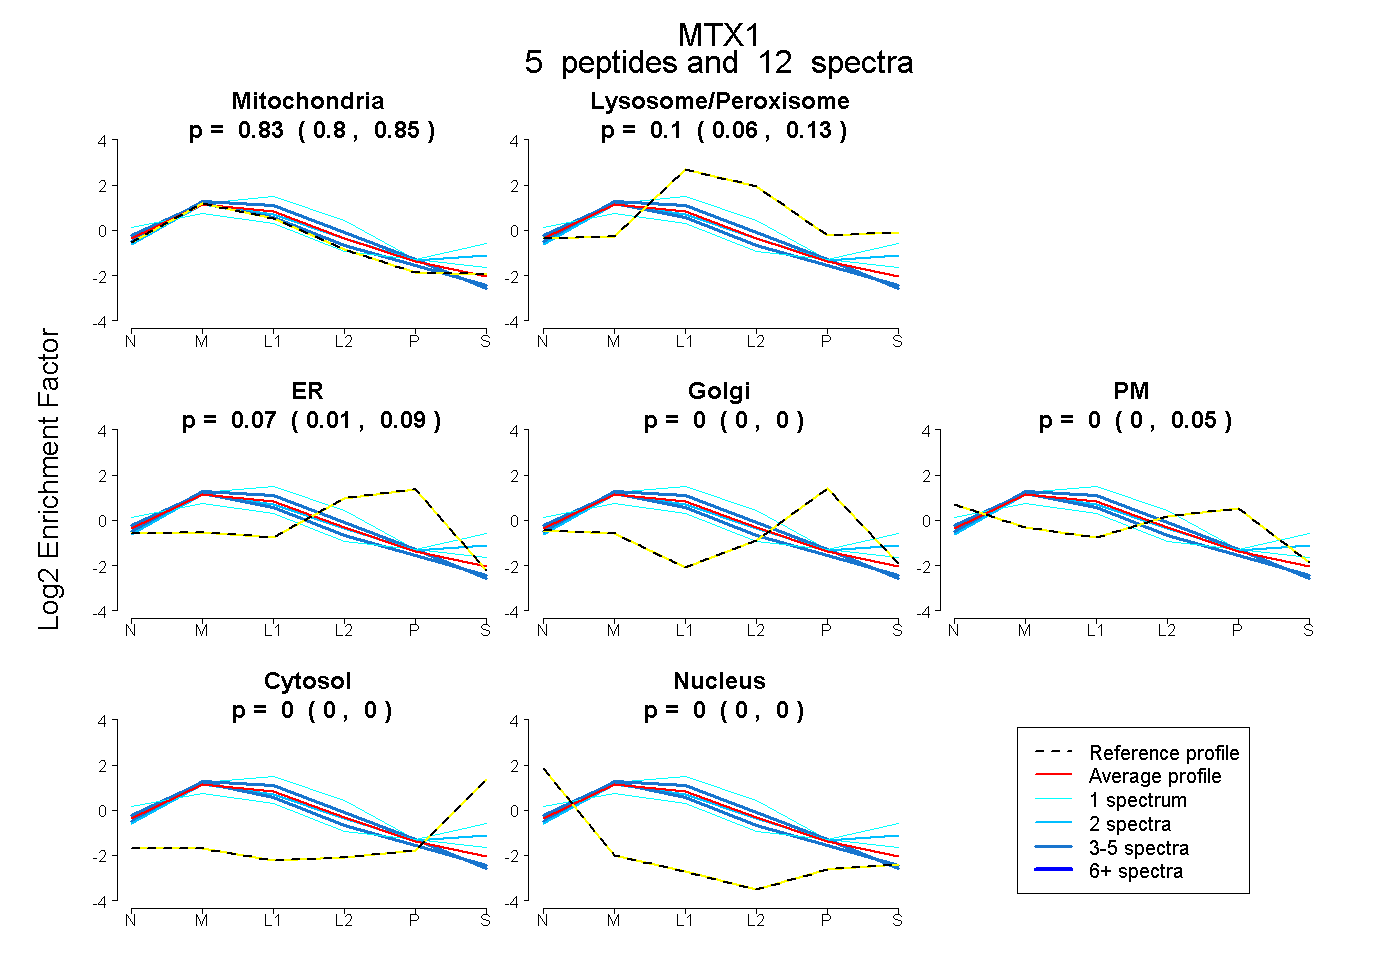
0.801 | 0.847
0.063 | 0.133
0.008 | 0.091
0.000 | 0.000
0.000 | 0.050
0.000 | 0.000
0.000 | 0.000
10peptides
spectra
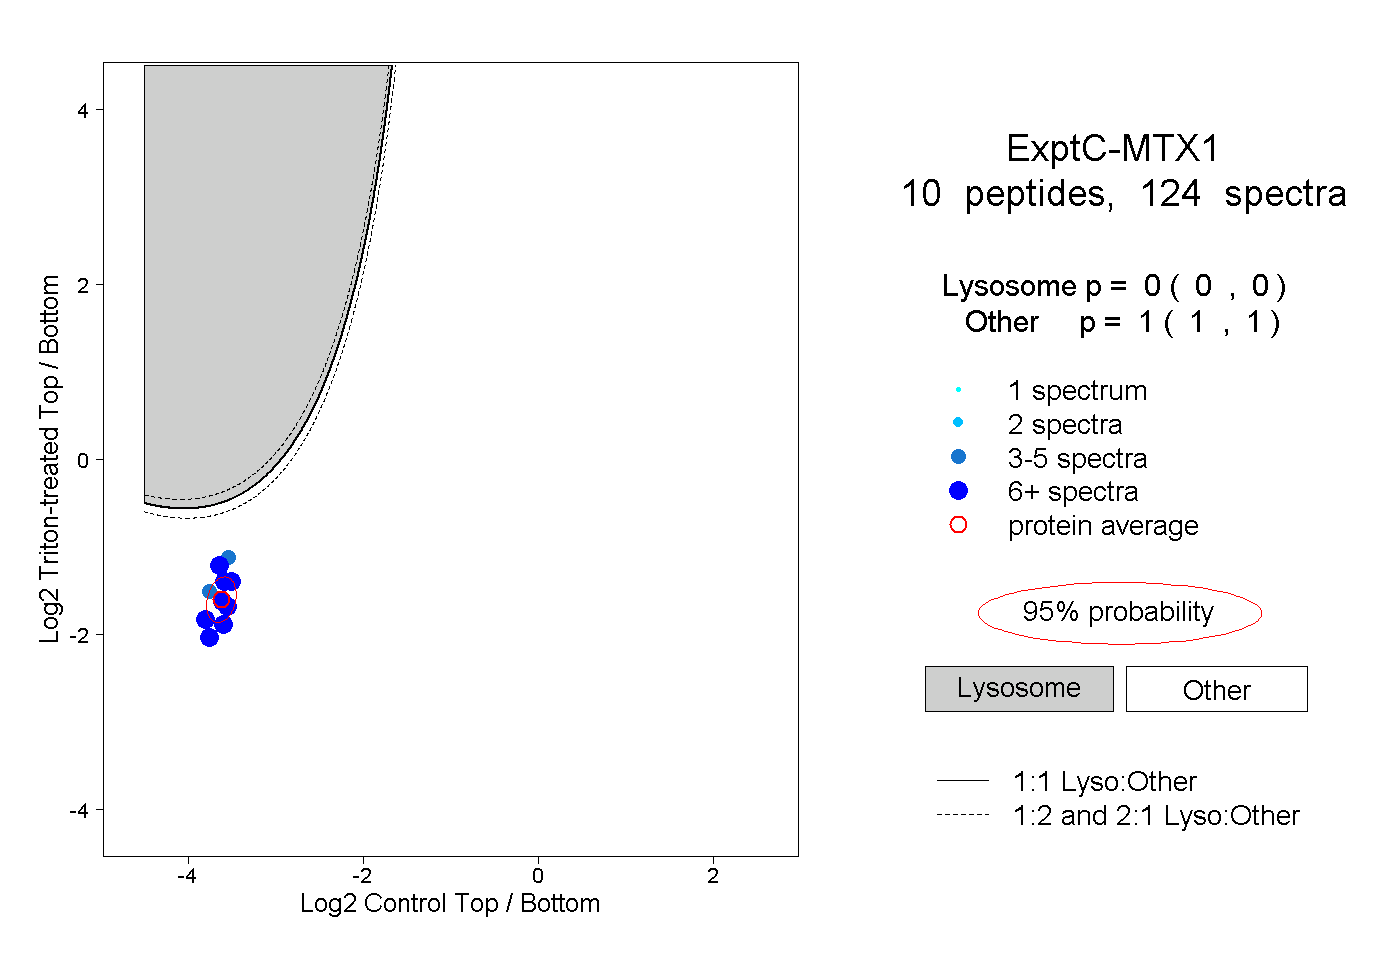
0.000 | 0.000
1.000 | 1.000
6peptides
spectra
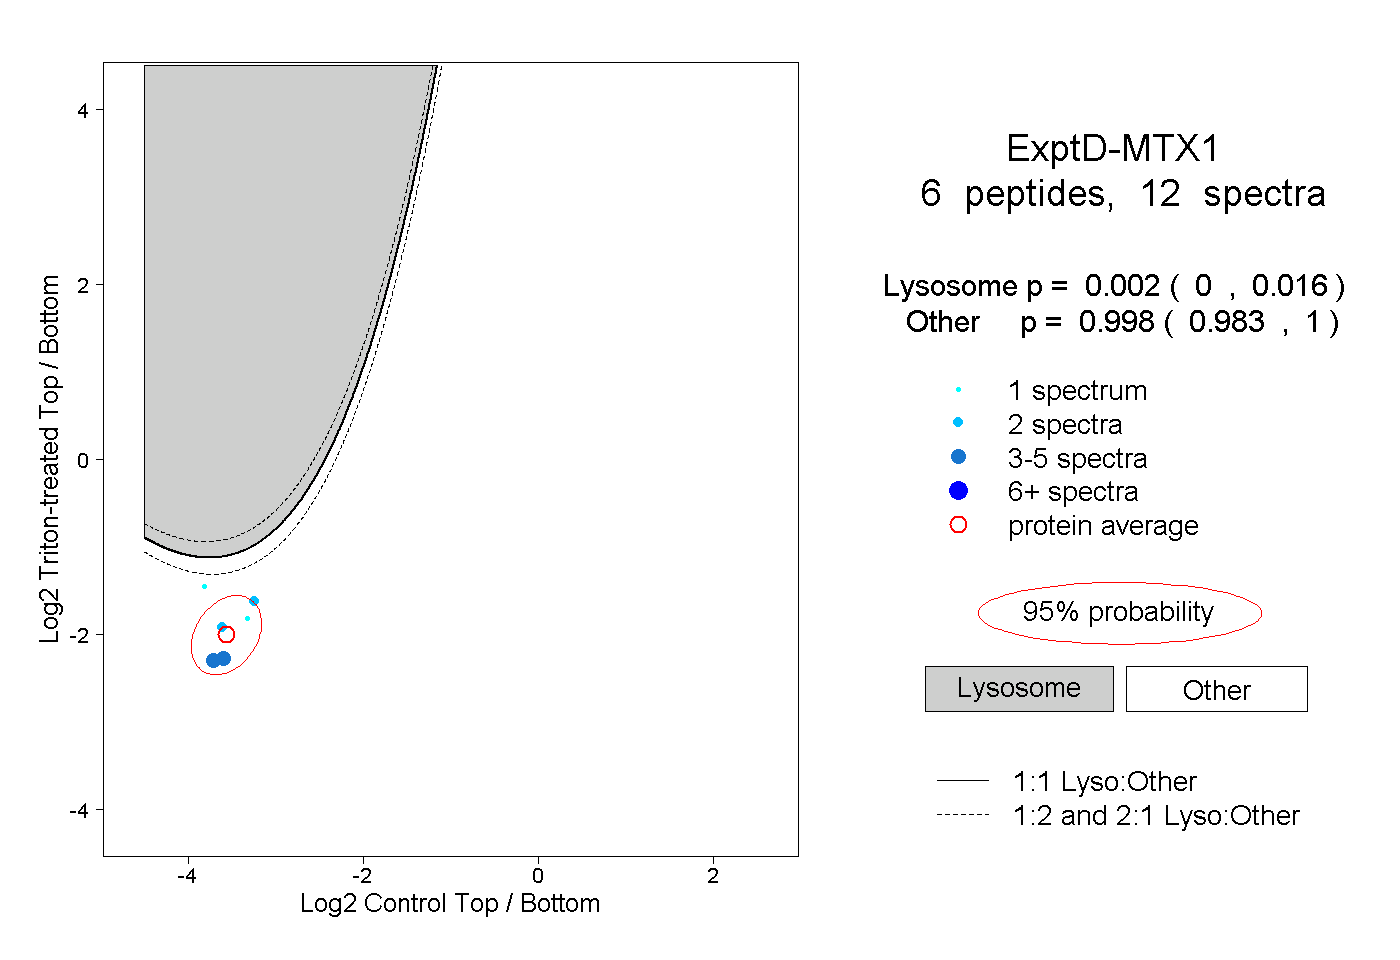
0.000 | 0.016
0.983 | 1.000