MTX1
[ENSRNOP00000061267]
Main page
| | | Plot |
Mito |
Lyso |
|
Perox |
ER |
Golgi |
PM |
Cytosol |
Nucleus |
|
| Expt A |
 5
5
peptides |
16
spectra |
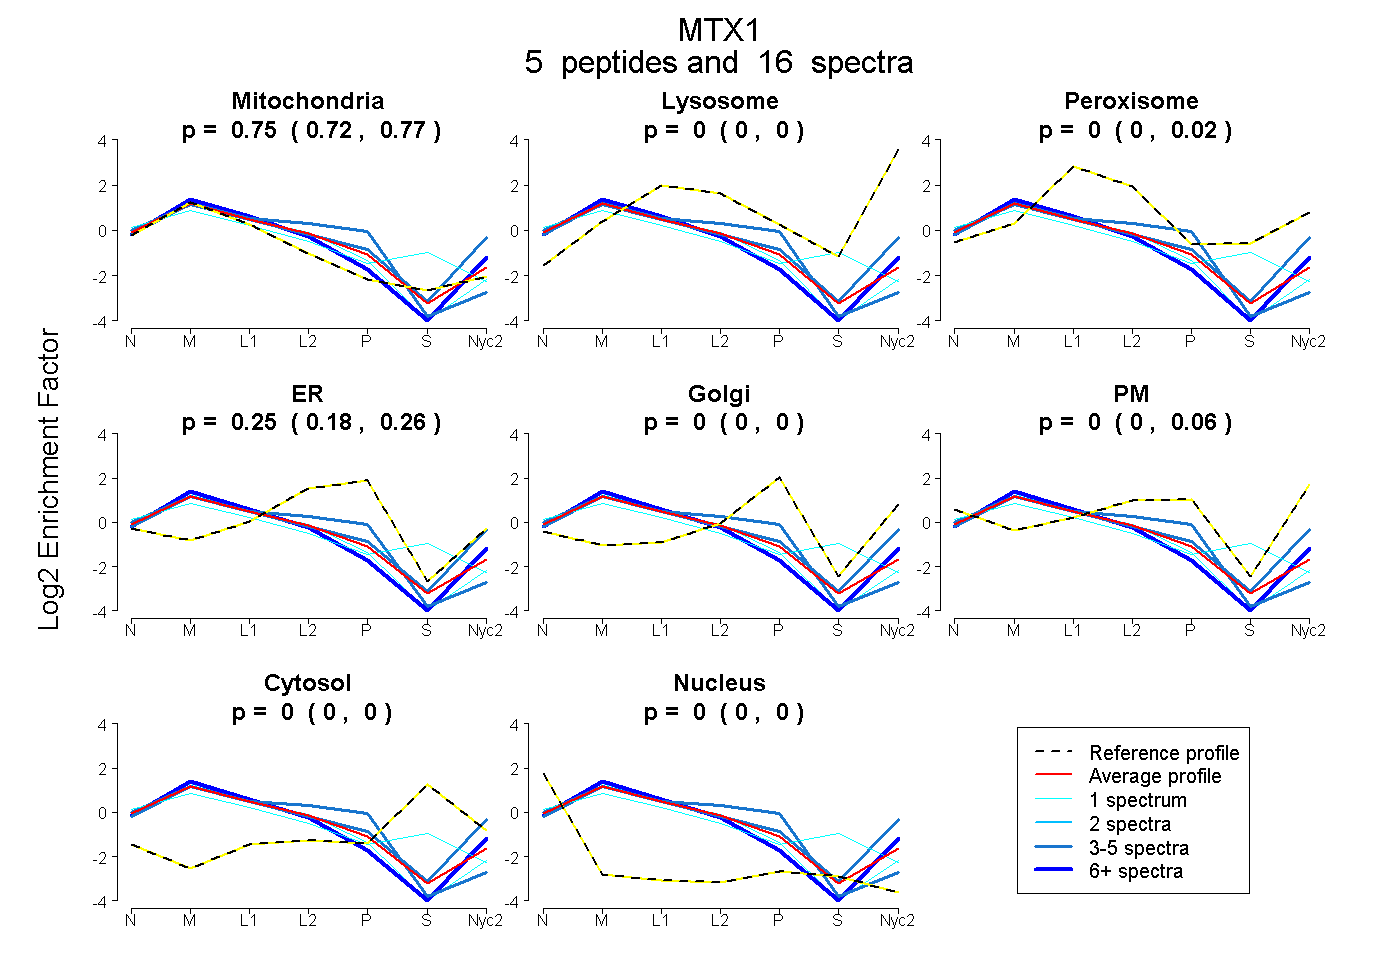 |
0.752
0.723 | 0.771 |
0.000
0.000 | 0.000 |
|
0.000
0.000 | 0.017 |
0.248
0.182 | 0.262 |
0.000
0.000 | 0.000 |
0.000
0.000 | 0.056 |
0.000
0.000 | 0.000 |
0.000
0.000 | 0.000 |
|
| | | Plot |
Mito |
|
Lyso or Perox |
|
ER |
Golgi |
PM |
Cytosol |
Nucleus |
|
| Expt B |
5
peptides |
12
spectra |
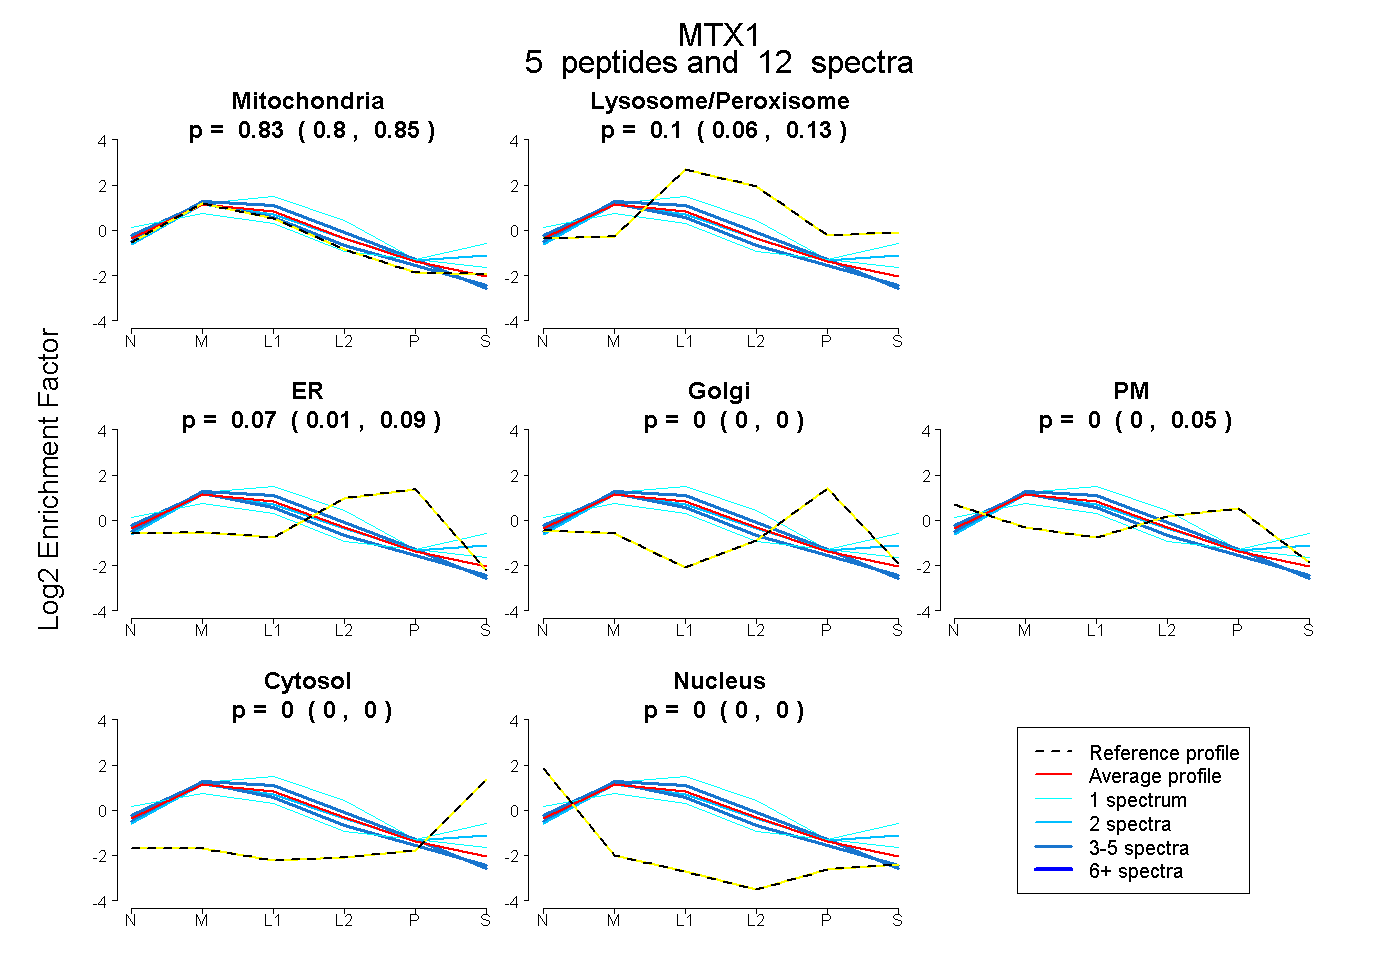 |
0.830
0.801 | 0.847 |
|
0.102
0.063 | 0.133 |
|
0.068
0.008 | 0.091 |
0.000
0.000 | 0.000 |
0.000
0.000 | 0.050 |
0.000
0.000 | 0.000 |
0.000
0.000 | 0.000 |
|
| 5 spectra, IITHLR |
0.814 |
|
0.104 |
|
0.081 |
0.000 |
0.000 |
0.000 |
0.000 |
|
| 1 spectrum, VITEPHK |
0.561 |
|
0.166 |
|
0.000 |
0.000 |
0.071 |
0.146 |
0.057 |
|
| 2 spectra, LQLLCGEHR |
0.734 |
|
0.193 |
|
0.000 |
0.013 |
0.000 |
0.059 |
0.000 |
|
| 3 spectra, NYVEVTR |
0.906 |
|
0.000 |
|
0.008 |
0.000 |
0.086 |
0.000 |
0.000 |
|
| 1 spectrum, ECLTLLSHR |
0.658 |
|
0.342 |
|
0.000 |
0.000 |
0.000 |
0.000 |
0.000 |
|
| | | Plot |
|
Lyso |
|
|
|
|
|
|
|
Other |
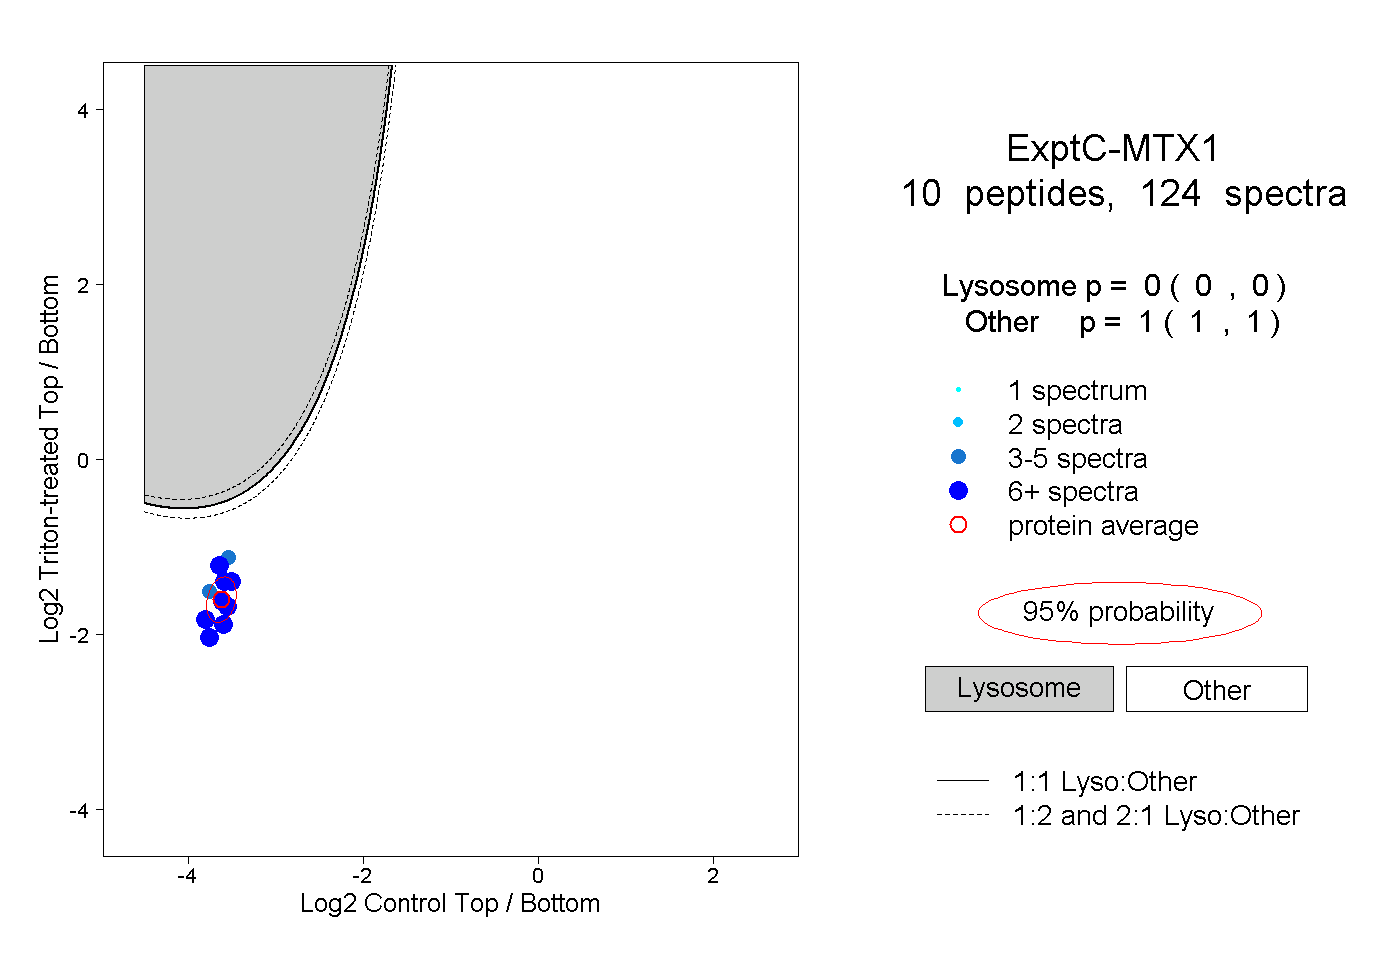
| Expt C |
10
peptides |
124
spectra |
 |
|
0.000
0.000 | 0.000 |
|
|
|
|
|
|
|
1.000
1.000 | 1.000 |
| | | Plot |
|
Lyso |
|
|
|
|
|
|
|
Other |
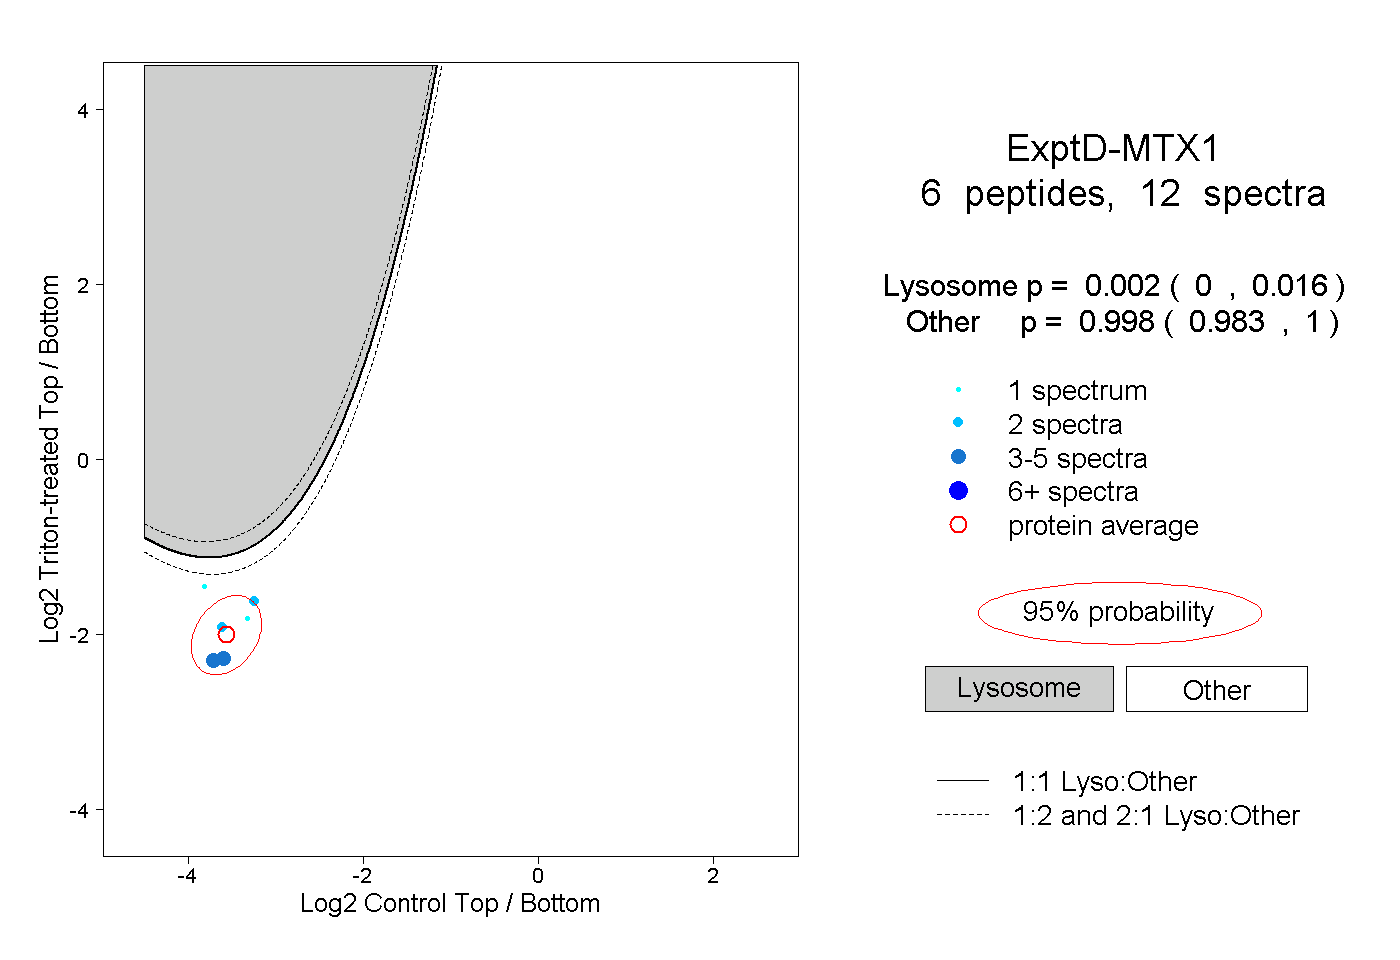
| Expt D |
6
peptides |
12
spectra |
 |
|
0.002
0.000 | 0.016 |
|
|
|
|
|
|
|
0.998
0.983 | 1.000 |