 86
86peptides
spectra
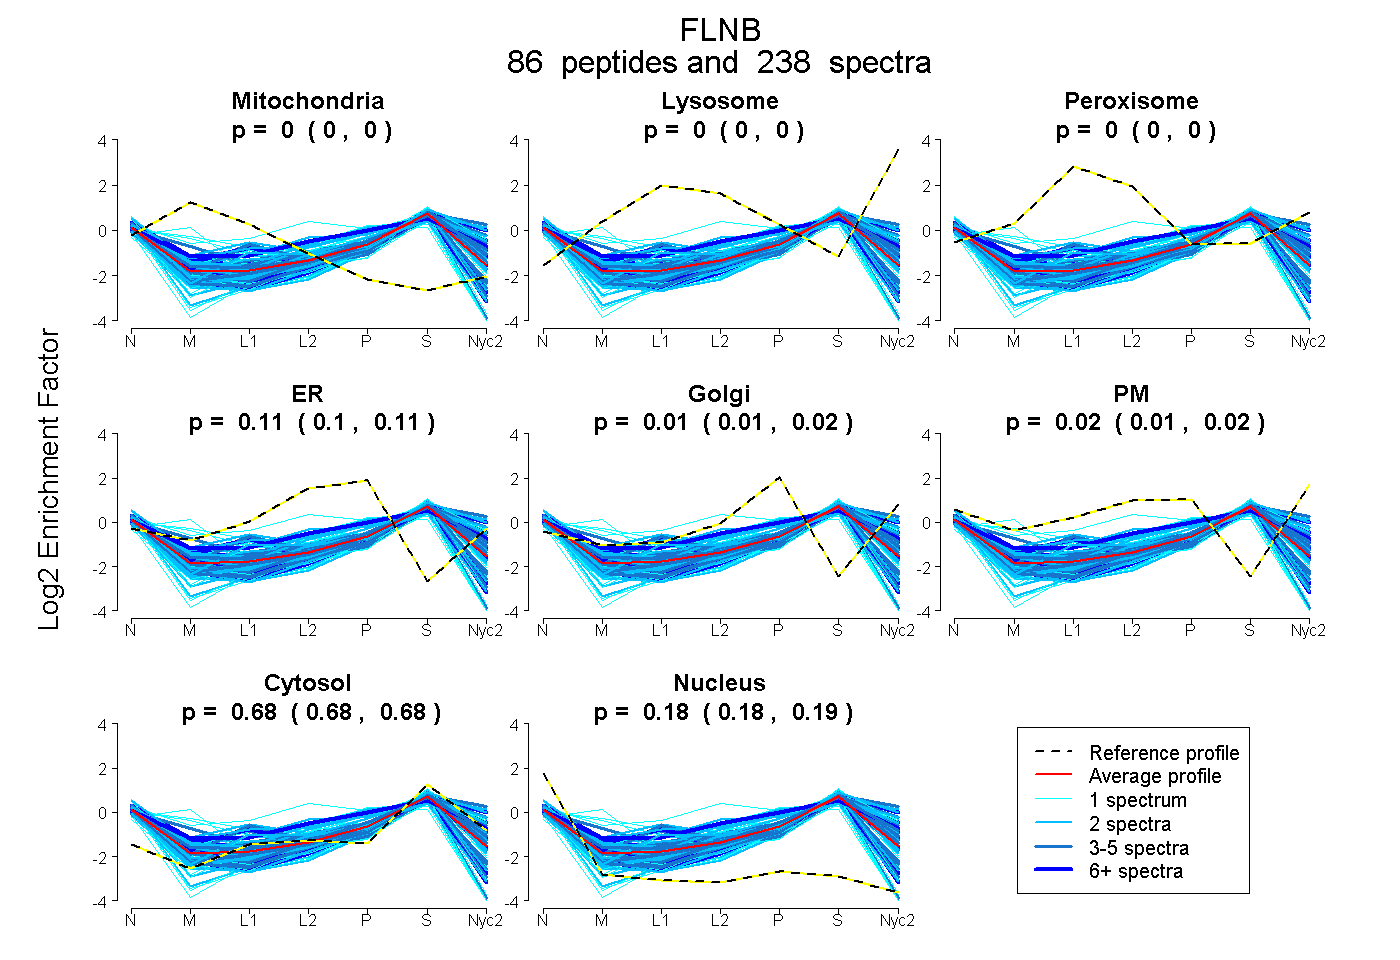
0.000 | 0.000
0.000 | 0.000
0.000 | 0.000
0.099 | 0.110
0.008 | 0.016
0.012 | 0.020
0.681 | 0.682
0.183 | 0.185
27peptides
spectra
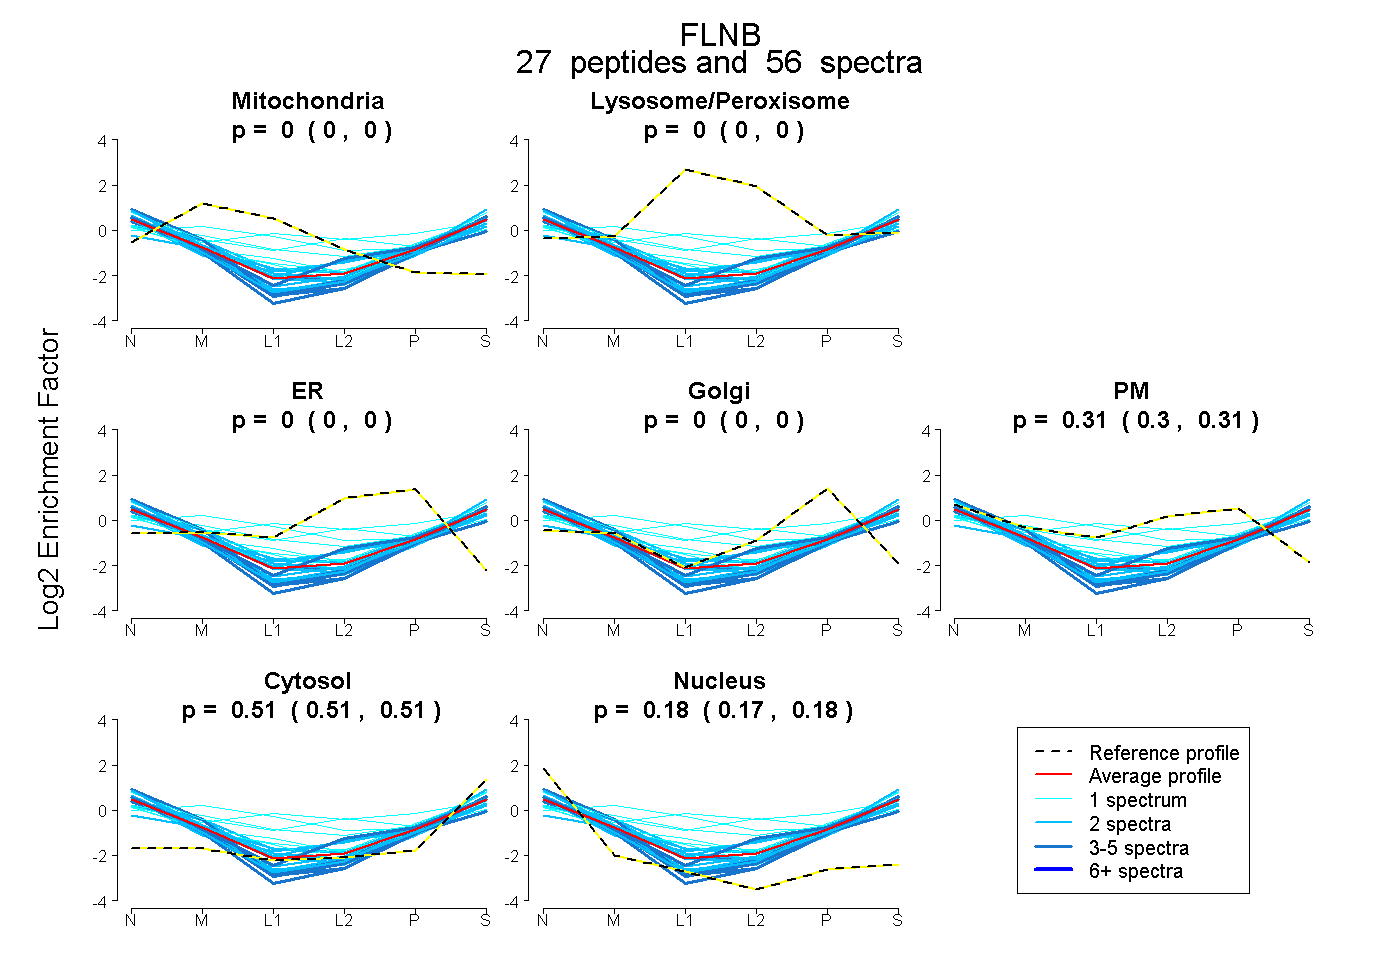
0.000 | 0.000
0.000 | 0.000
0.000 | 0.000
0.000 | 0.000
0.305 | 0.313
0.510 | 0.515
0.174 | 0.182
66peptides
spectra
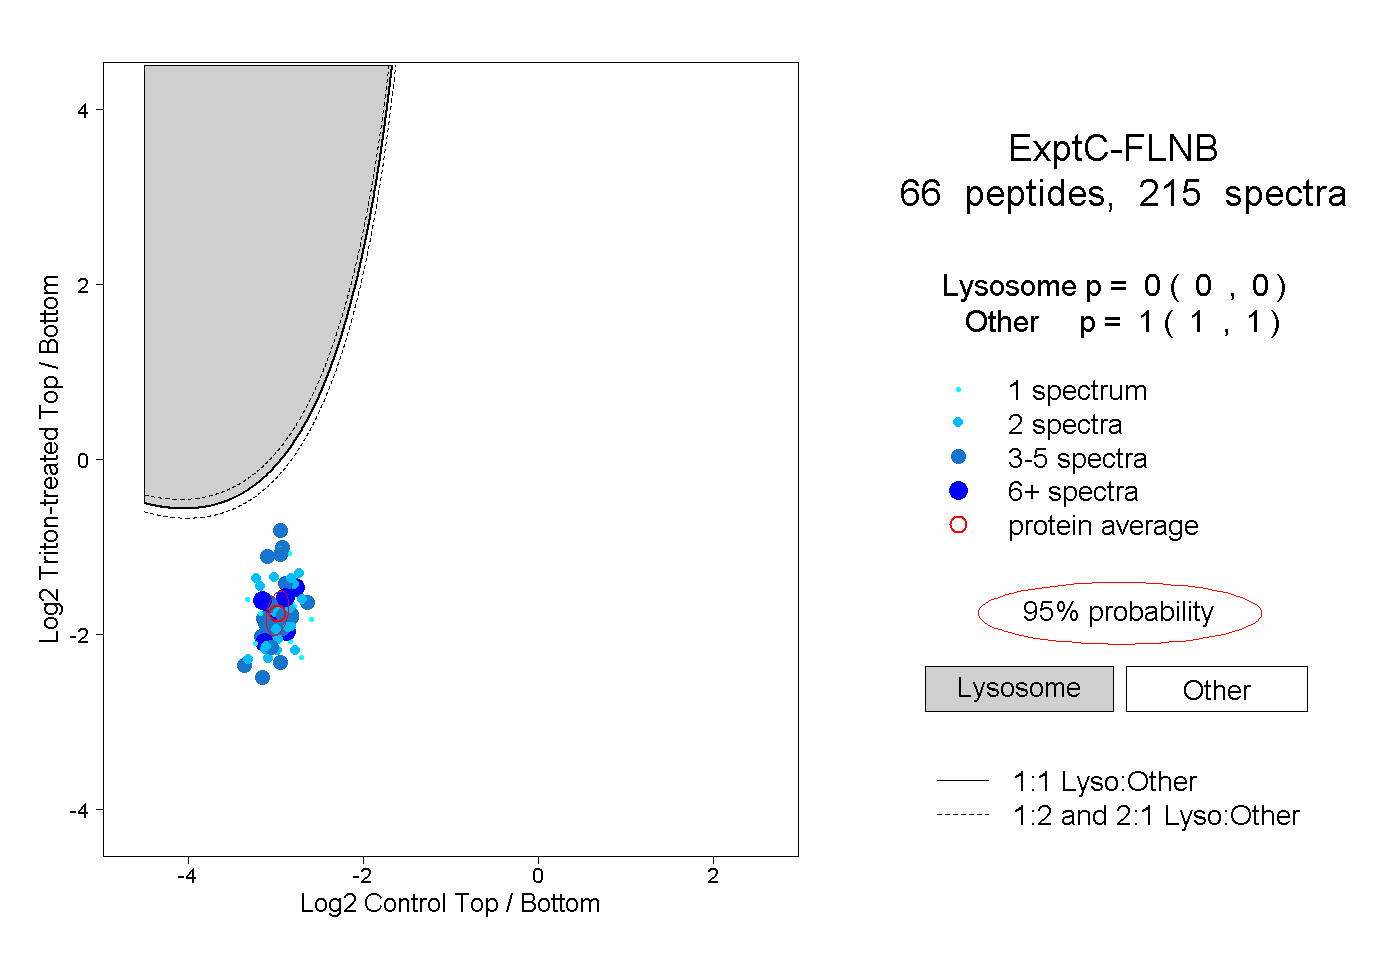
0.000 | 0.000
1.000 | 1.000
12peptides
spectra
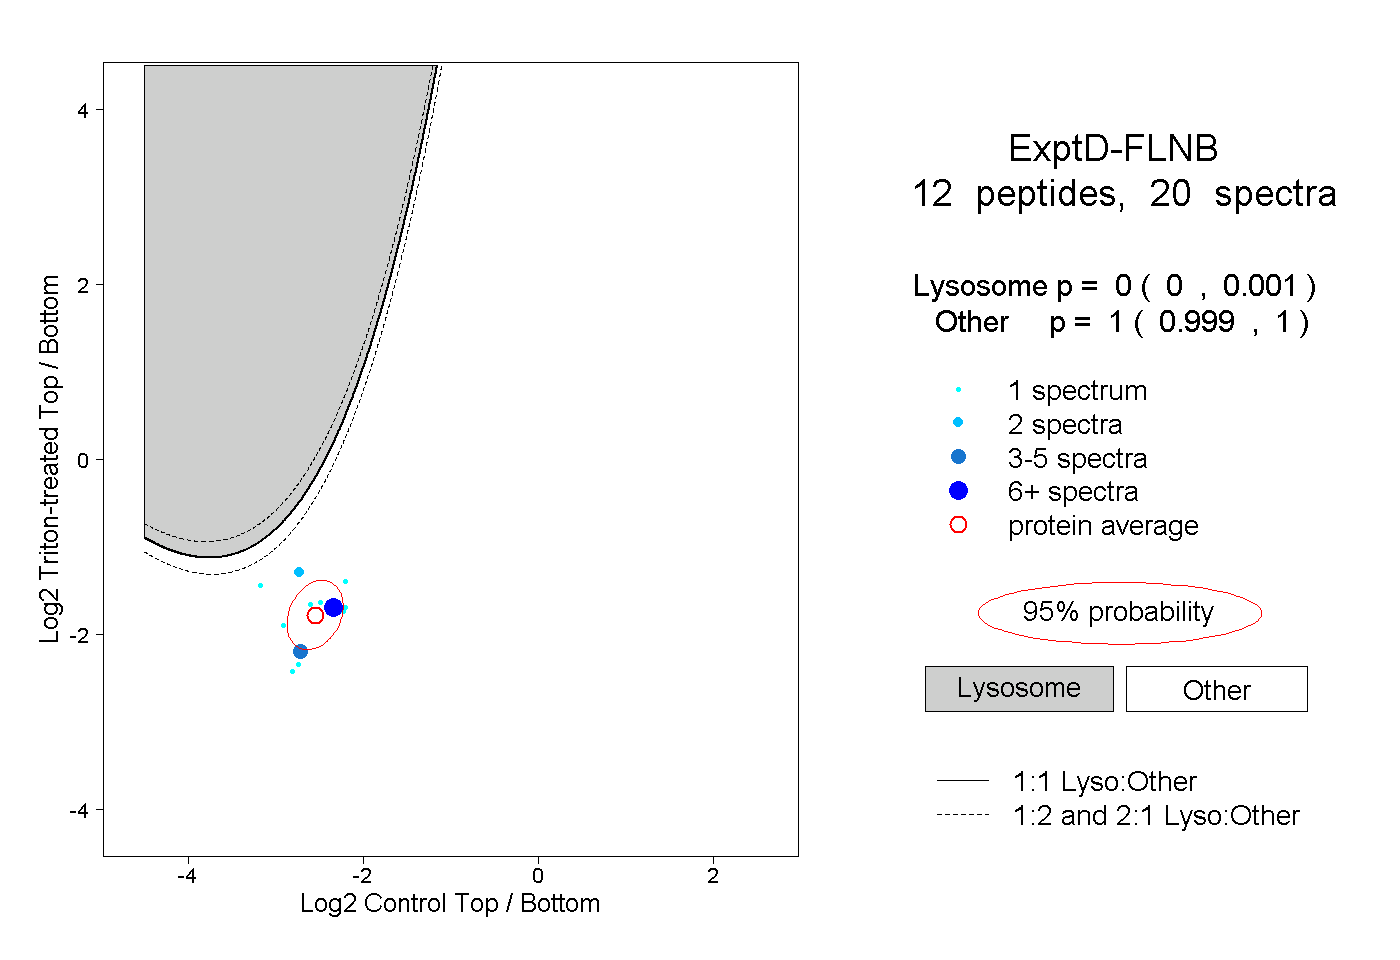
0.000 | 0.001
0.999 | 1.000