 19
19peptides
spectra
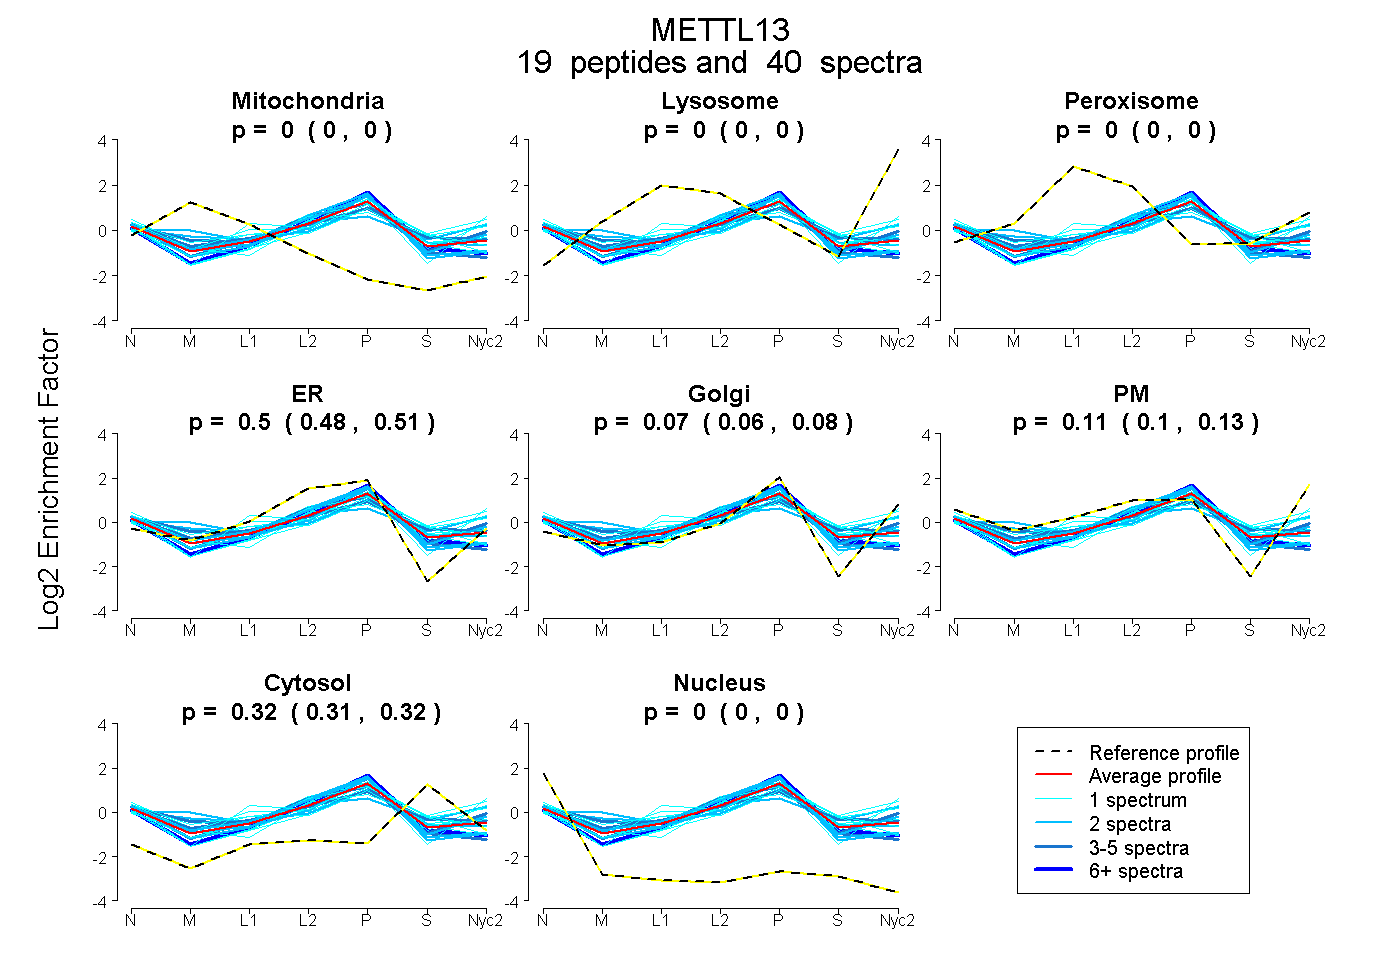
0.000 | 0.000
0.000 | 0.000
0.000 | 0.000
0.480 | 0.512
0.057 | 0.081
0.099 | 0.125
0.314 | 0.323
0.000 | 0.003
6peptides
spectra
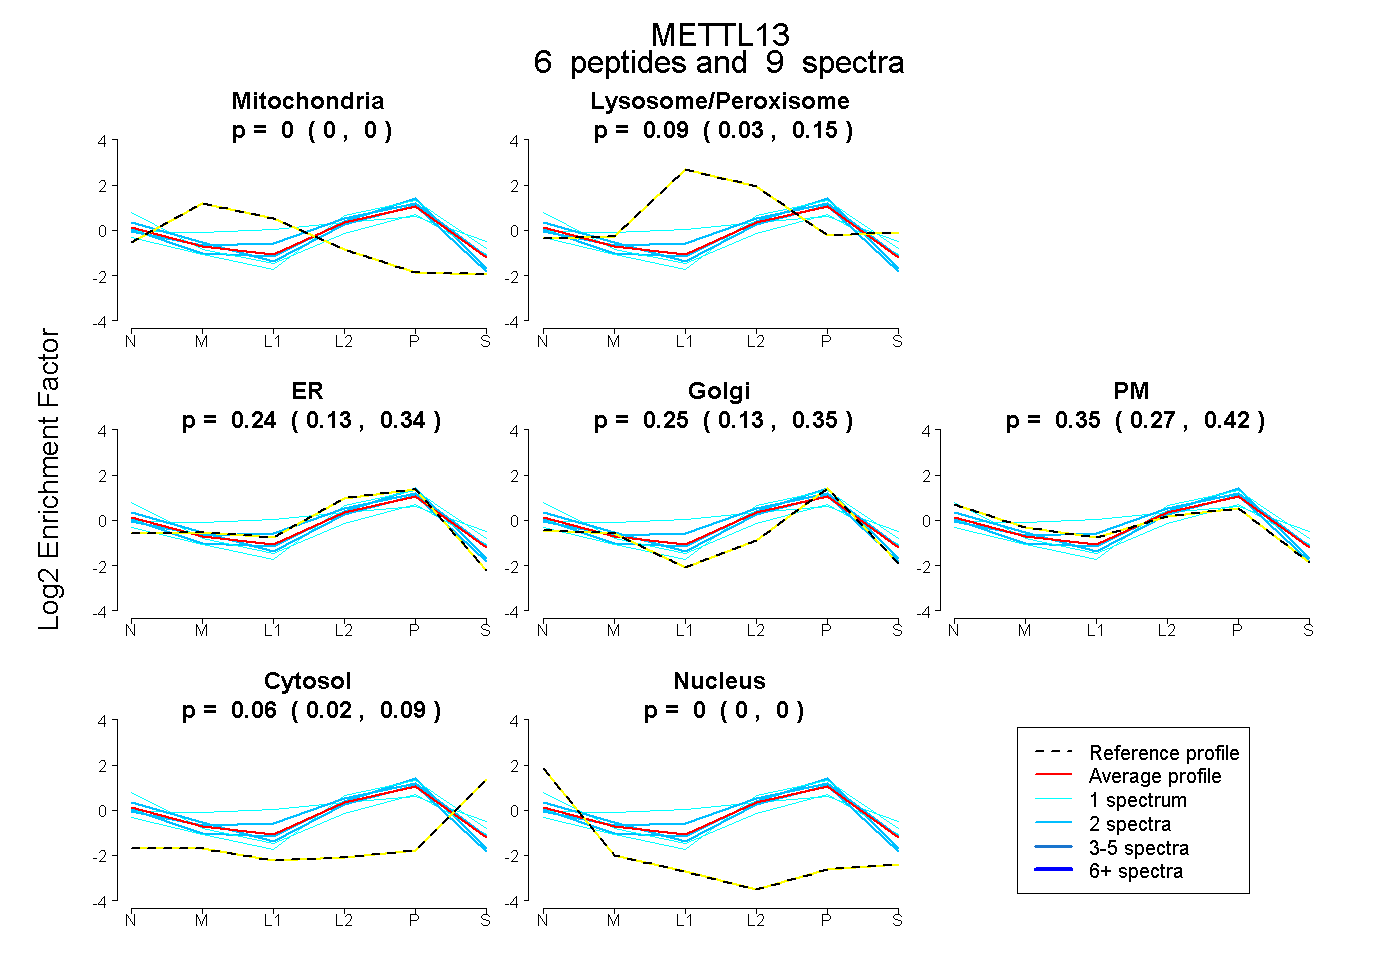
0.000 | 0.000
0.027 | 0.149
0.126 | 0.337
0.130 | 0.354
0.268 | 0.416
0.023 | 0.093
0.000 | 0.000
8peptides
spectra
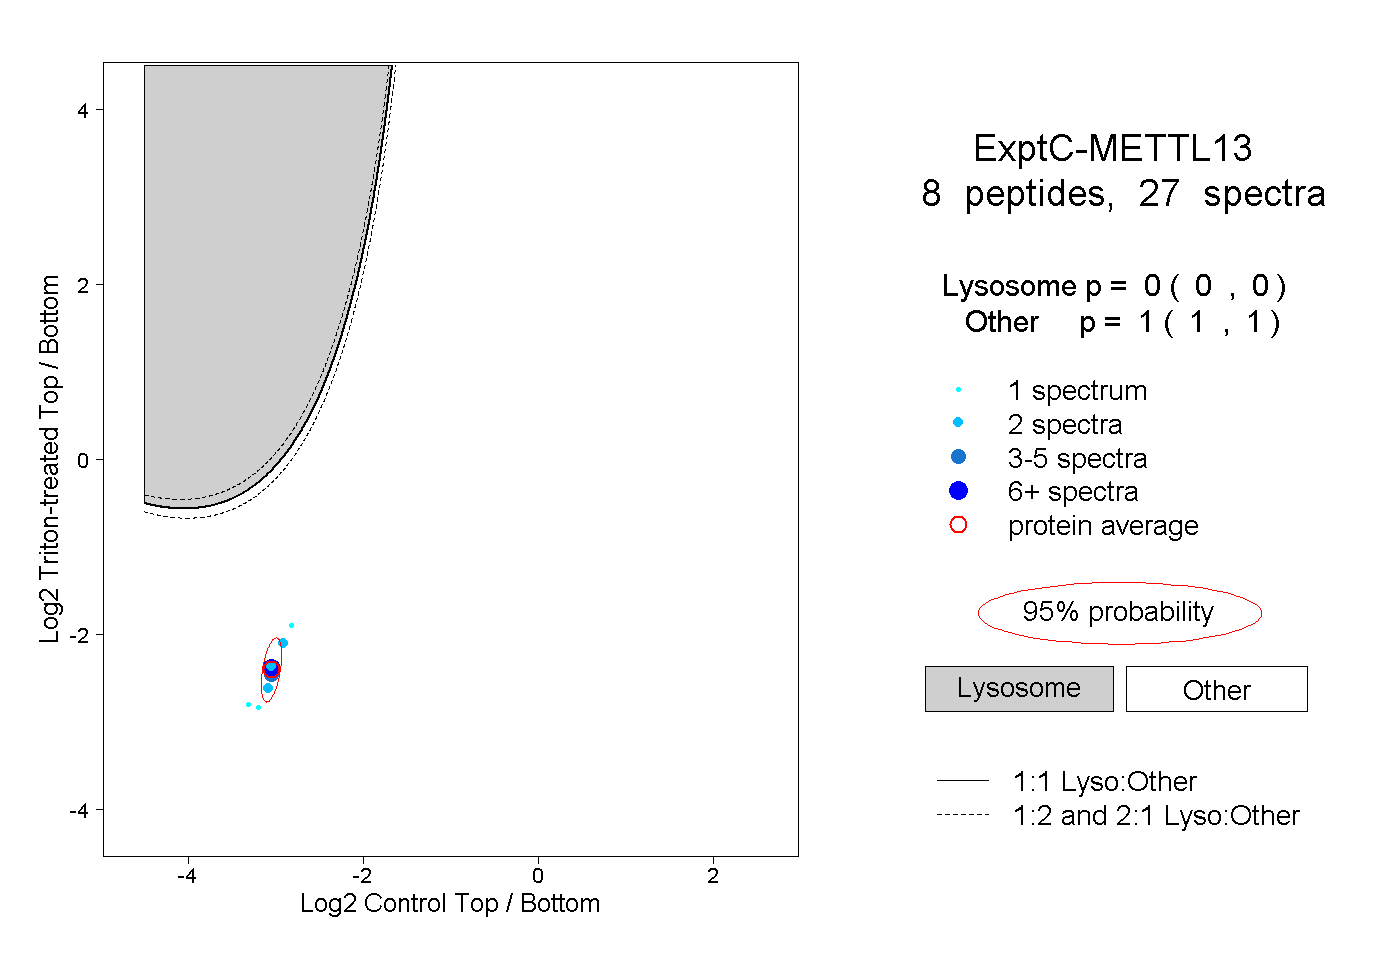
0.000 | 0.000
1.000 | 1.000
3peptides
spectra
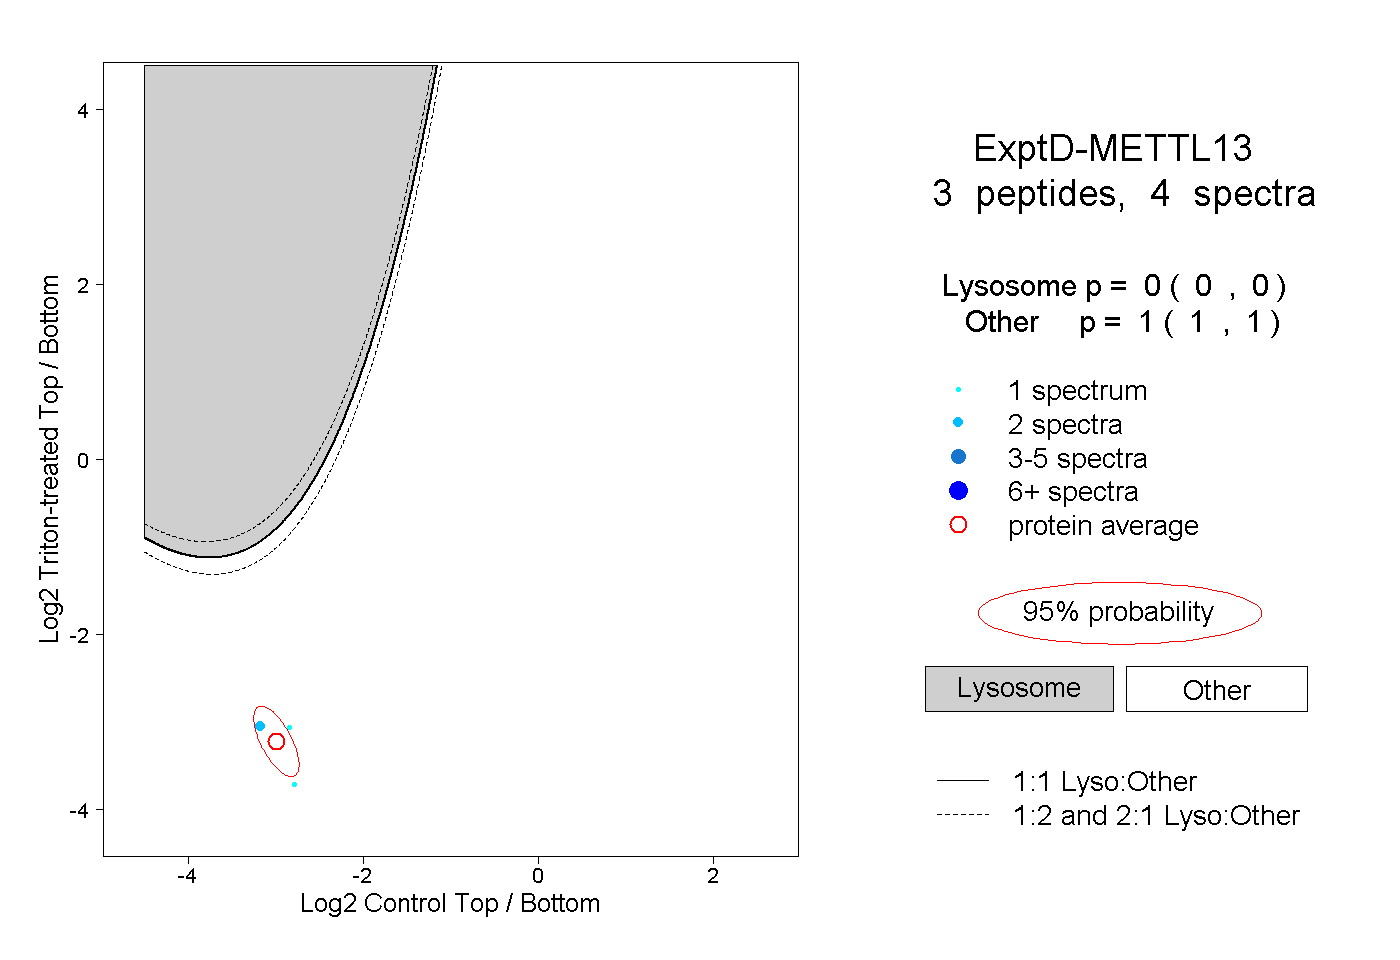
0.000 | 0.000
1.000 | 1.000