 19
19peptides
spectra
0.000 | 0.000
0.000 | 0.000
0.000 | 0.000
0.480 | 0.512
0.057 | 0.081
0.099 | 0.125
0.314 | 0.323
0.000 | 0.003
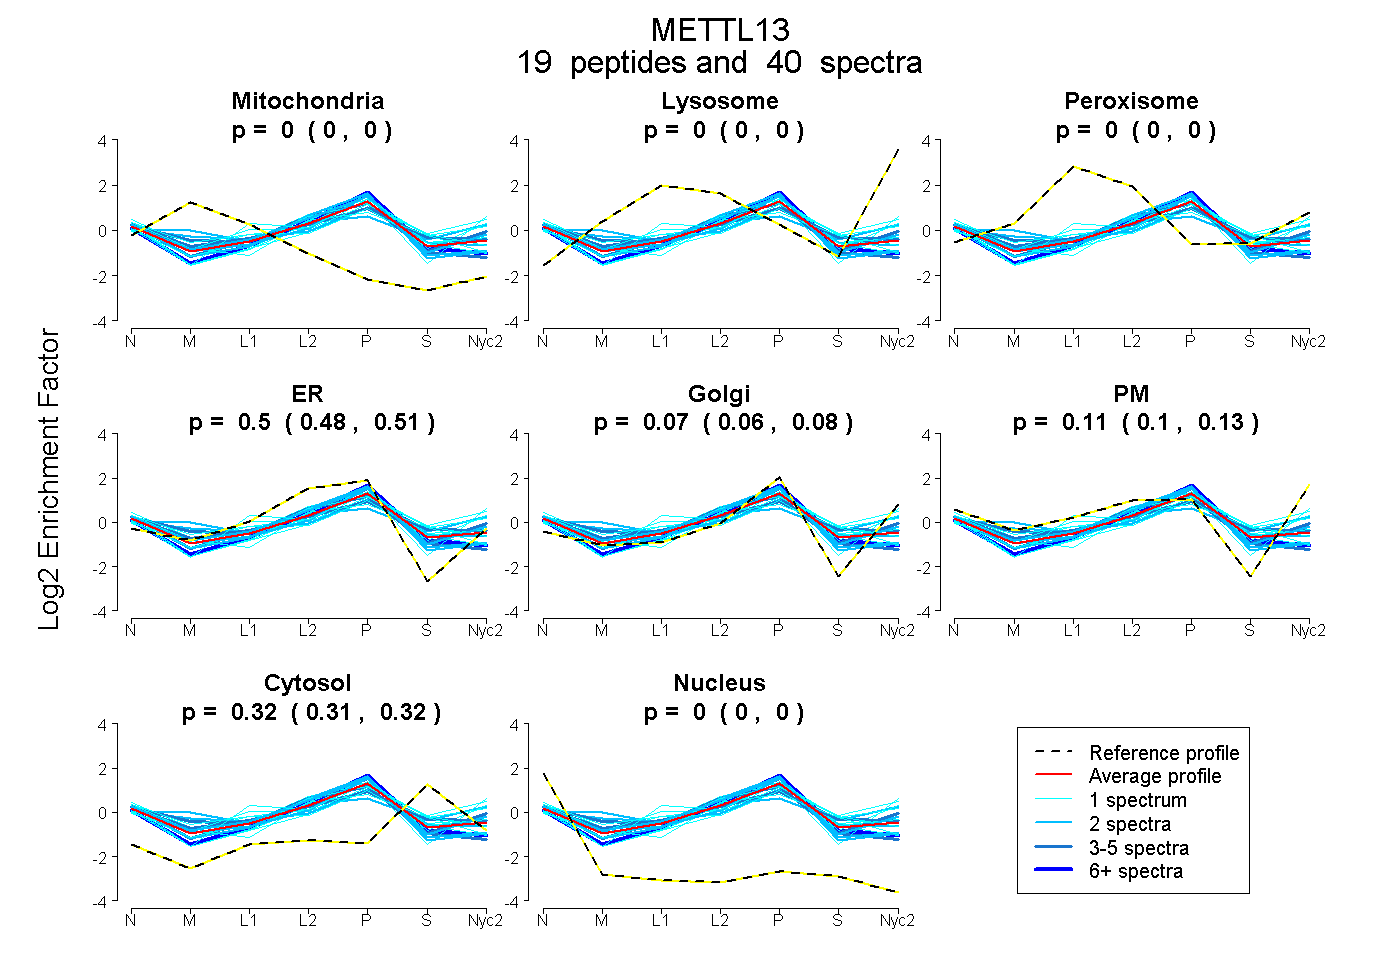
| Plot | Mito | Lyso | Perox | ER | Golgi | PM | Cytosol | Nucleus | |||||
| Expt A |
19 peptides |
40 spectra |
|
0.000 0.000 | 0.000 |
0.000 0.000 | 0.000 |
0.000 0.000 | 0.000 |
0.497 0.480 | 0.512 |
0.070 0.057 | 0.081 |
0.113 0.099 | 0.125 |
0.320 0.314 | 0.323 |
0.000 0.000 | 0.003 |
| 1 spectrum, SVVQSEAR | 0.000 | 0.016 | 0.027 | 0.209 | 0.072 | 0.336 | 0.339 | 0.000 | ||
| 1 spectrum, LIFLSNR | 0.000 | 0.000 | 0.000 | 0.224 | 0.143 | 0.485 | 0.147 | 0.000 | ||
| 4 spectra, LVTVALHR | 0.014 | 0.000 | 0.000 | 0.411 | 0.000 | 0.325 | 0.250 | 0.000 | ||
| 1 spectrum, FSLPVFAFVMTK | 0.000 | 0.000 | 0.000 | 0.179 | 0.386 | 0.174 | 0.261 | 0.000 | ||
| 9 spectra, AMIAGLALLR | 0.000 | 0.000 | 0.000 | 0.644 | 0.024 | 0.000 | 0.296 | 0.036 | ||
| 1 spectrum, SYLCCEHHK | 0.000 | 0.000 | 0.147 | 0.387 | 0.115 | 0.000 | 0.351 | 0.000 | ||
| 3 spectra, QHYAWLCSQLR | 0.000 | 0.000 | 0.059 | 0.386 | 0.000 | 0.190 | 0.365 | 0.000 | ||
| 1 spectrum, YTLHVVDNPAVKPSR | 0.000 | 0.000 | 0.070 | 0.551 | 0.000 | 0.000 | 0.378 | 0.000 | ||
| 1 spectrum, VHQVTNSQDQVSEAEPR | 0.000 | 0.000 | 0.000 | 0.175 | 0.033 | 0.401 | 0.392 | 0.000 | ||
| 1 spectrum, QQPADLSEDVPPAPGQCIDK | 0.009 | 0.000 | 0.237 | 0.092 | 0.404 | 0.000 | 0.188 | 0.071 | ||
| 2 spectra, VLQVGGR | 0.000 | 0.000 | 0.000 | 0.550 | 0.164 | 0.000 | 0.211 | 0.075 | ||
| 2 spectra, ESVLAGLR | 0.116 | 0.000 | 0.088 | 0.288 | 0.244 | 0.000 | 0.264 | 0.000 | ||
| 2 spectra, DNHFAIFIIPQGR | 0.058 | 0.000 | 0.151 | 0.027 | 0.190 | 0.303 | 0.272 | 0.000 | ||
| 1 spectrum, LATPELLEQAQALER | 0.000 | 0.000 | 0.000 | 0.634 | 0.000 | 0.000 | 0.336 | 0.030 | ||
| 4 spectra, AAFPLLYVR | 0.000 | 0.000 | 0.000 | 0.685 | 0.000 | 0.000 | 0.249 | 0.066 | ||
| 1 spectrum, EFGSADYWEK | 0.000 | 0.000 | 0.000 | 0.279 | 0.339 | 0.029 | 0.338 | 0.015 | ||
| 2 spectra, QLASSAGFR | 0.000 | 0.000 | 0.000 | 0.719 | 0.022 | 0.000 | 0.195 | 0.064 | ||
| 2 spectra, YDSMESIQAELSAR | 0.000 | 0.000 | 0.001 | 0.496 | 0.106 | 0.157 | 0.239 | 0.000 | ||
| 1 spectrum, EGWMVR | 0.000 | 0.000 | 0.107 | 0.301 | 0.387 | 0.000 | 0.206 | 0.000 |
| Plot | Mito | Lyso or Perox | ER | Golgi | PM | Cytosol | Nucleus | ||||||
| Expt B |
6 peptides |
9 spectra |
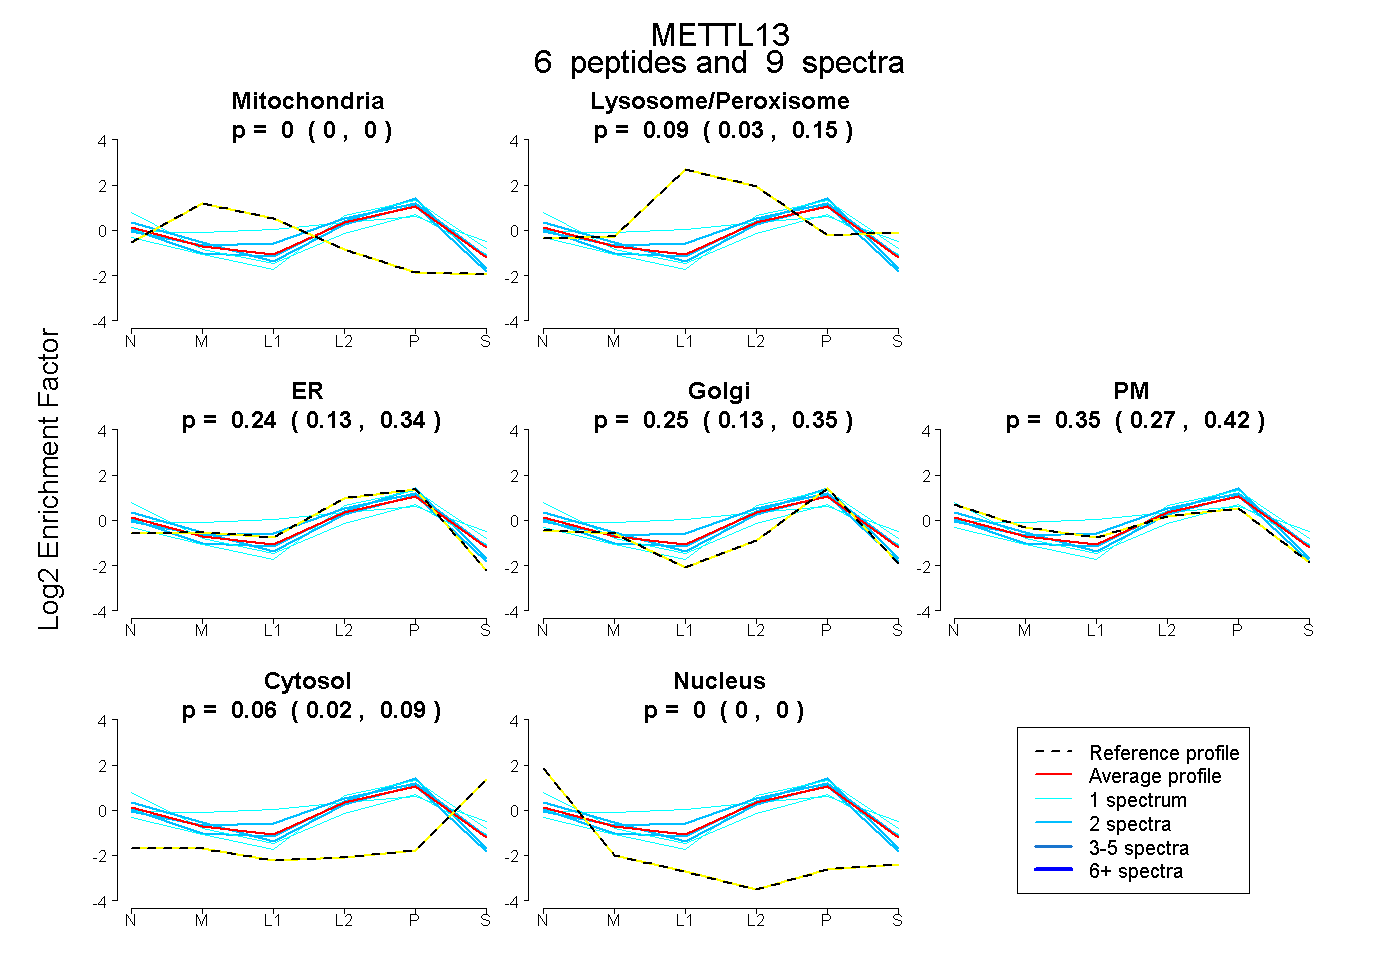 |
0.000 0.000 | 0.000 |
0.090 0.027 | 0.149 |
0.244 0.126 | 0.337 |
0.249 0.130 | 0.354 |
0.354 0.268 | 0.416 |
0.063 0.023 | 0.093 |
0.000 0.000 | 0.000 |
|||
| Plot | Lyso | Other | |||||||||||
| Expt C |
8 peptides |
27 spectra |
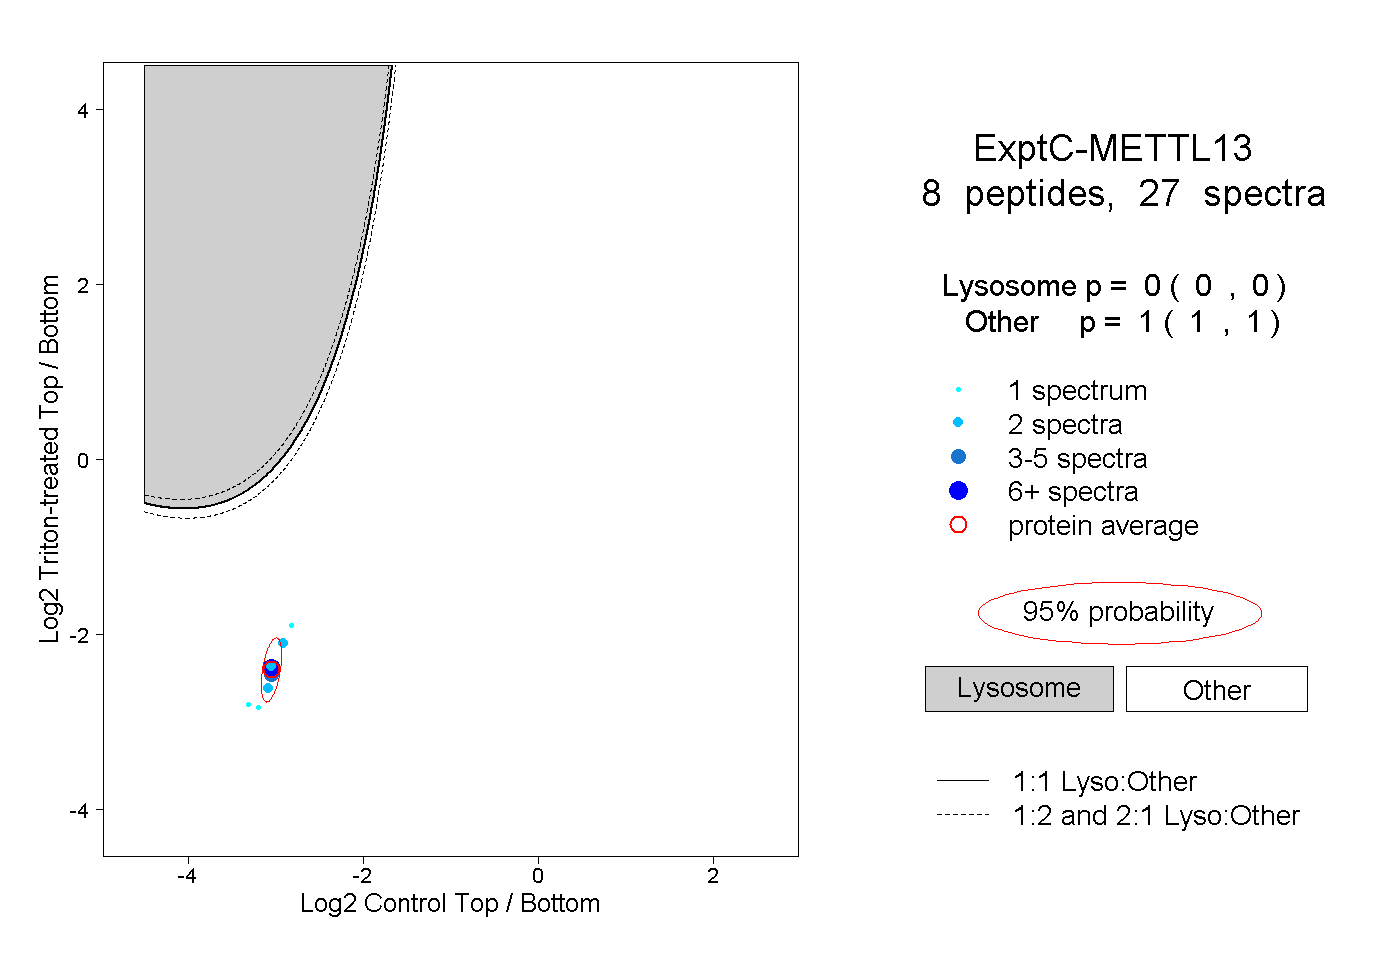 |
0.000 0.000 | 0.000 |
1.000 1.000 | 1.000 |
||||||||
| Plot | Lyso | Other | |||||||||||
| Expt D |
3 peptides |
4 spectra |
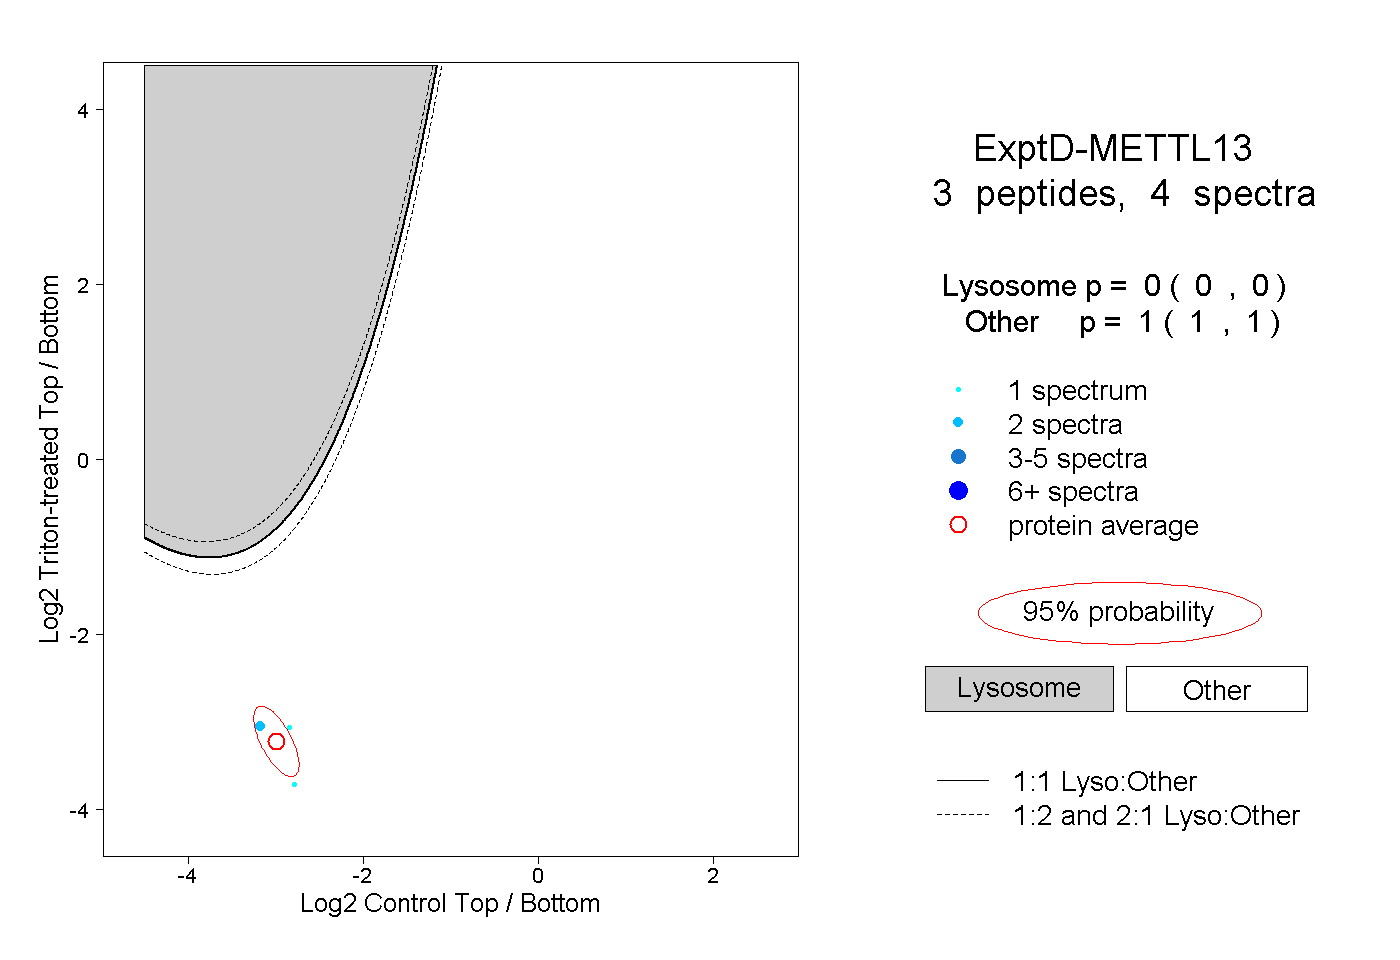 |
0.000 0.000 | 0.000 |
1.000 1.000 | 1.000 |