 2
2peptides
spectra
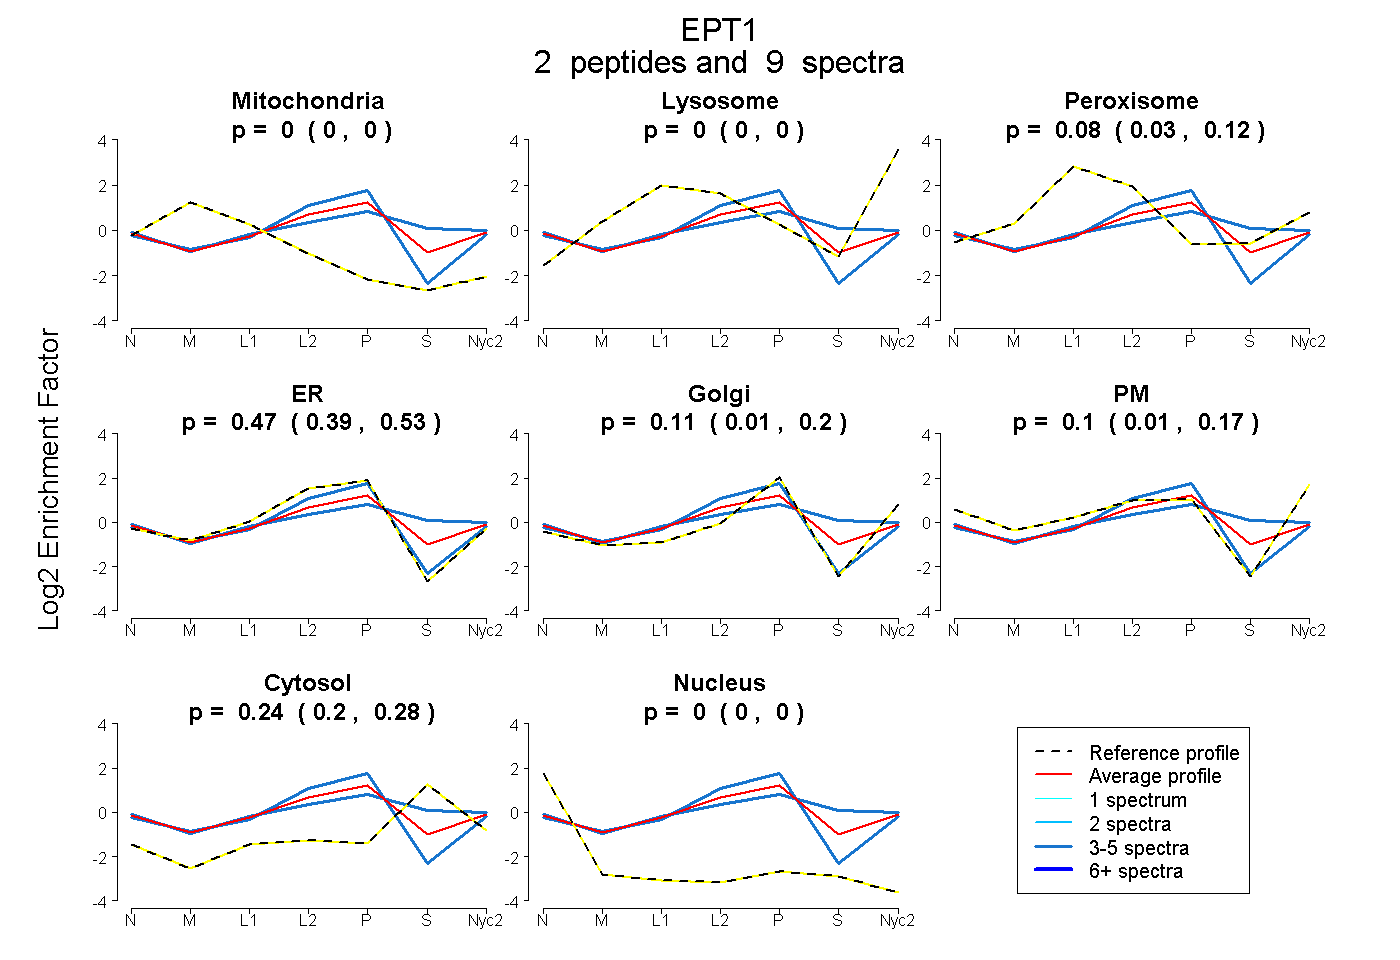
0.000 | 0.000
0.000 | 0.000
0.027 | 0.115
0.393 | 0.534
0.012 | 0.202
0.014 | 0.167
0.202 | 0.276
0.000 | 0.000
1peptide
spectra
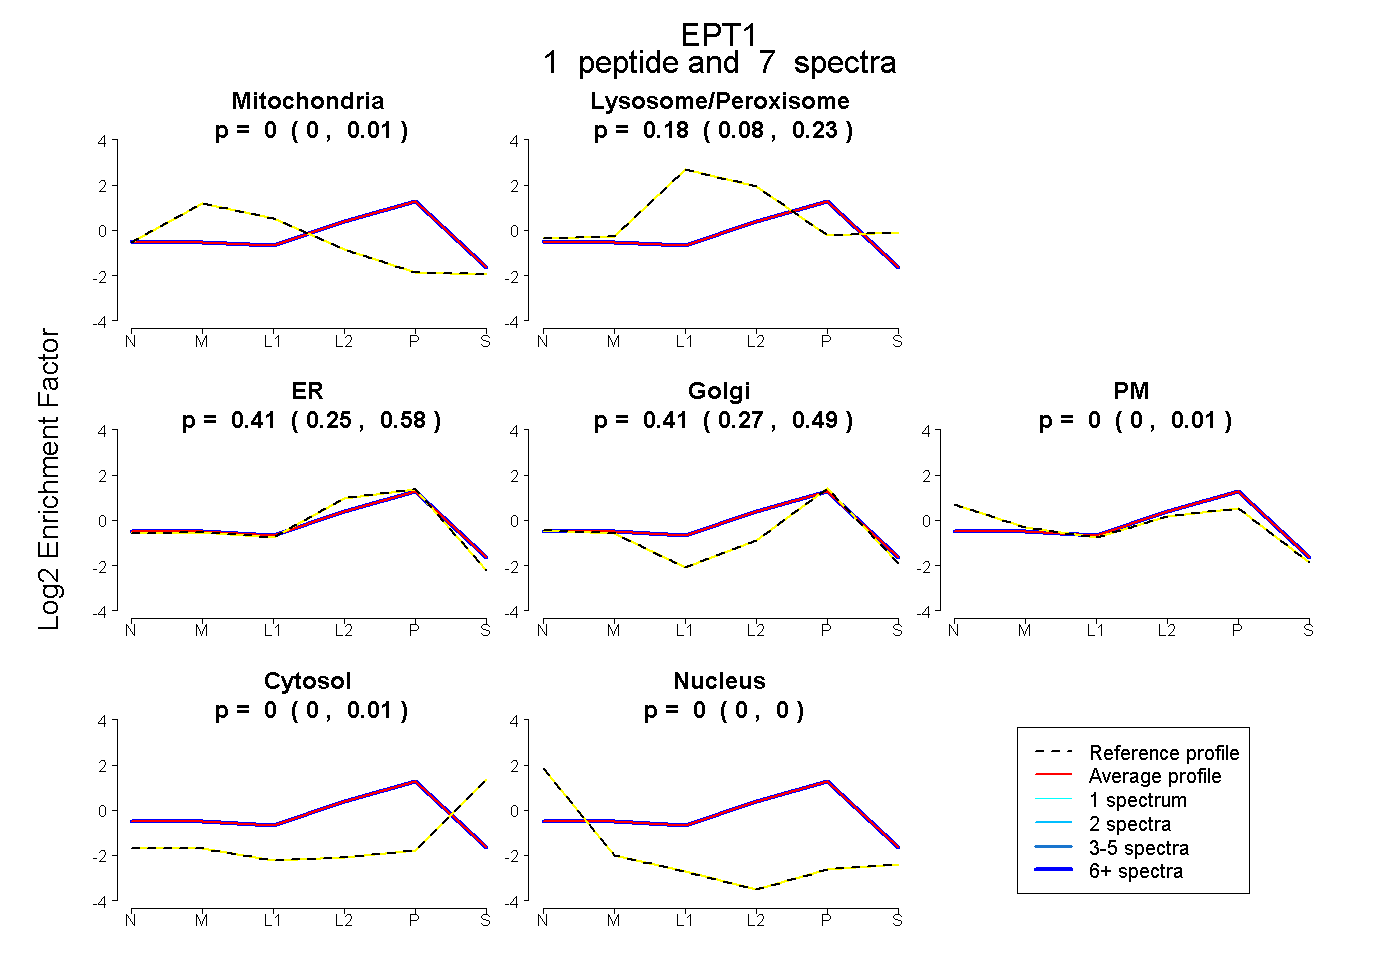
0.000 | 0.006
0.084 | 0.234
0.253 | 0.575
0.268 | 0.491
0.000 | 0.015
0.000 | 0.008
0.000 | 0.000
2peptides
spectra
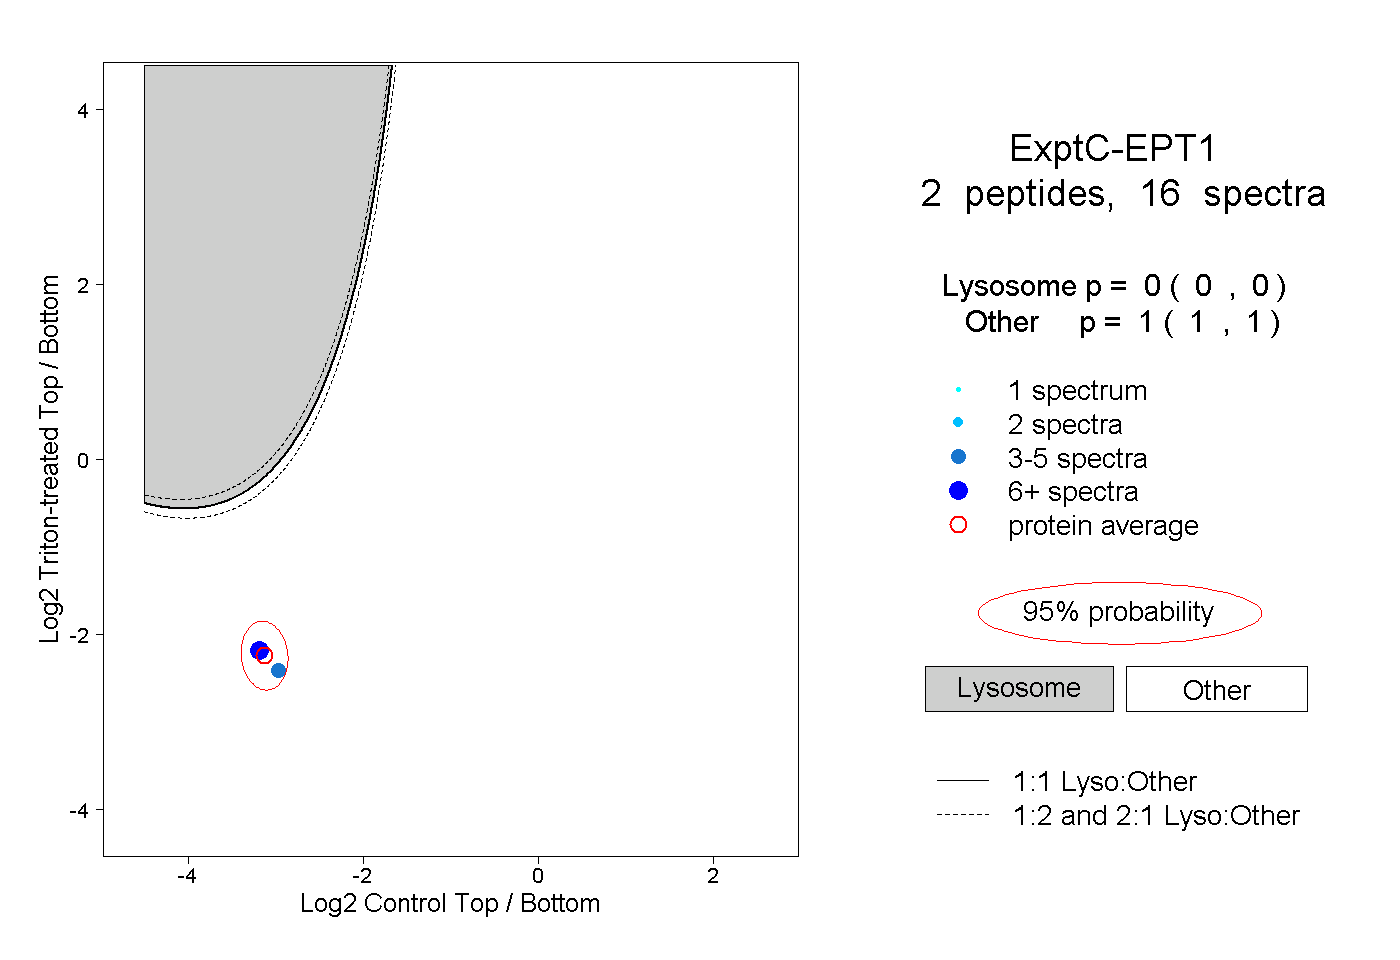
0.000 | 0.000
1.000 | 1.000
1peptide
spectrum

NA | NA
NA | NA