 2
2peptides
spectra
0.000 | 0.000
0.000 | 0.000
0.027 | 0.115
0.393 | 0.534
0.012 | 0.202
0.014 | 0.167
0.202 | 0.276
0.000 | 0.000
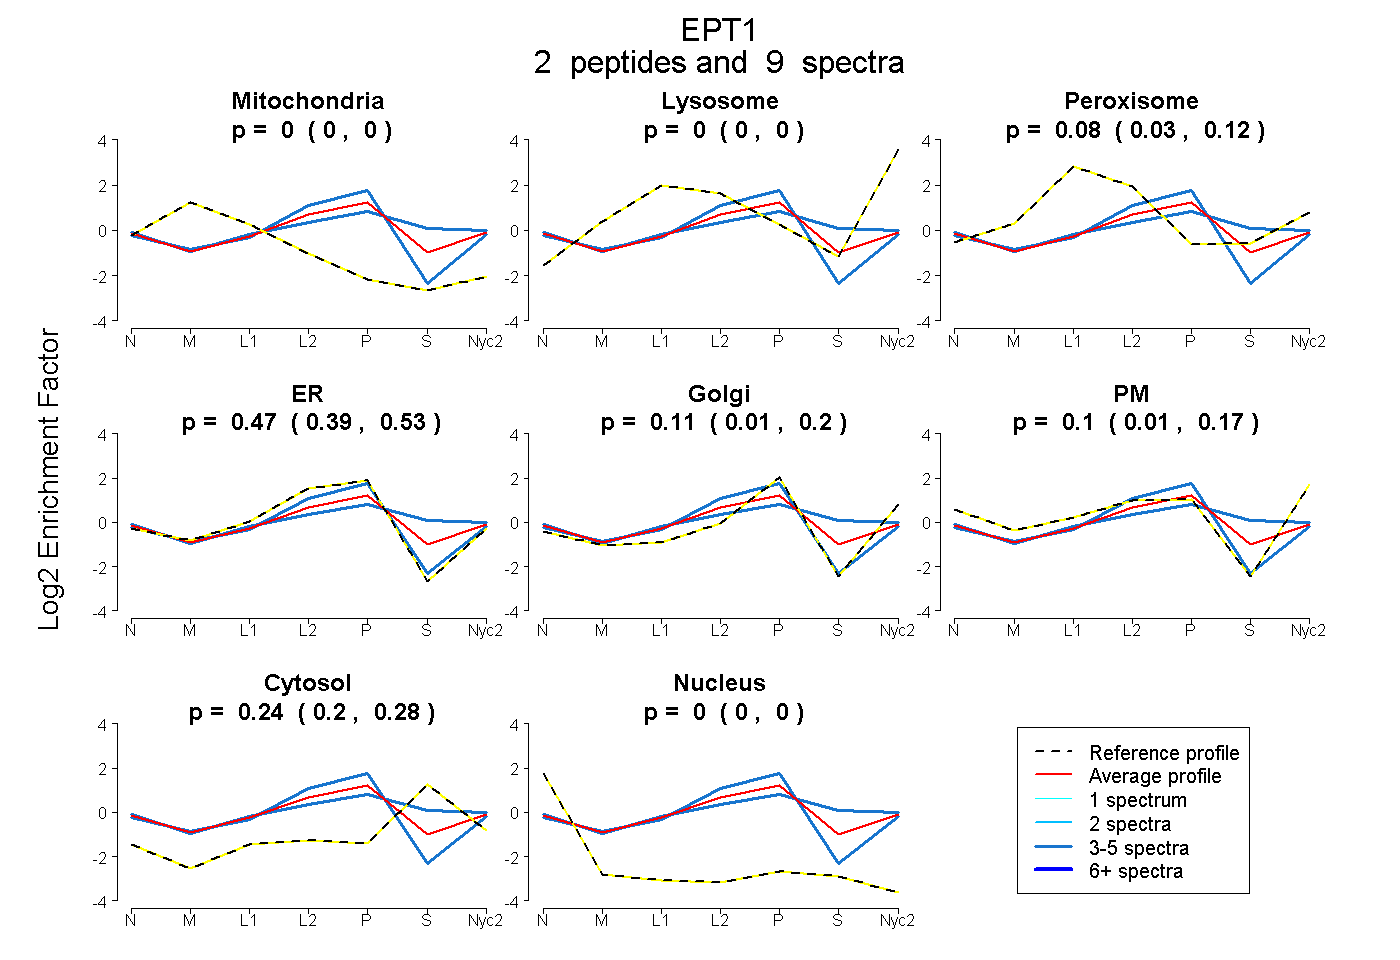
| Plot | Mito | Lyso | Perox | ER | Golgi | PM | Cytosol | Nucleus | |||||
| Expt A |
2 peptides |
9 spectra |
|
0.000 0.000 | 0.000 |
0.000 0.000 | 0.000 |
0.076 0.027 | 0.115 |
0.469 0.393 | 0.534 |
0.114 0.012 | 0.202 |
0.099 0.014 | 0.167 |
0.242 0.202 | 0.276 |
0.000 0.000 | 0.000 |
| 4 spectra, HFQIYPFSLR | 0.000 | 0.000 | 0.000 | 0.753 | 0.171 | 0.010 | 0.048 | 0.018 | ||
| 5 spectra, SPSDILEMHPR | 0.000 | 0.000 | 0.182 | 0.198 | 0.146 | 0.106 | 0.367 | 0.000 |
| Plot | Mito | Lyso or Perox | ER | Golgi | PM | Cytosol | Nucleus | ||||||
| Expt B |
1 peptide |
7 spectra |
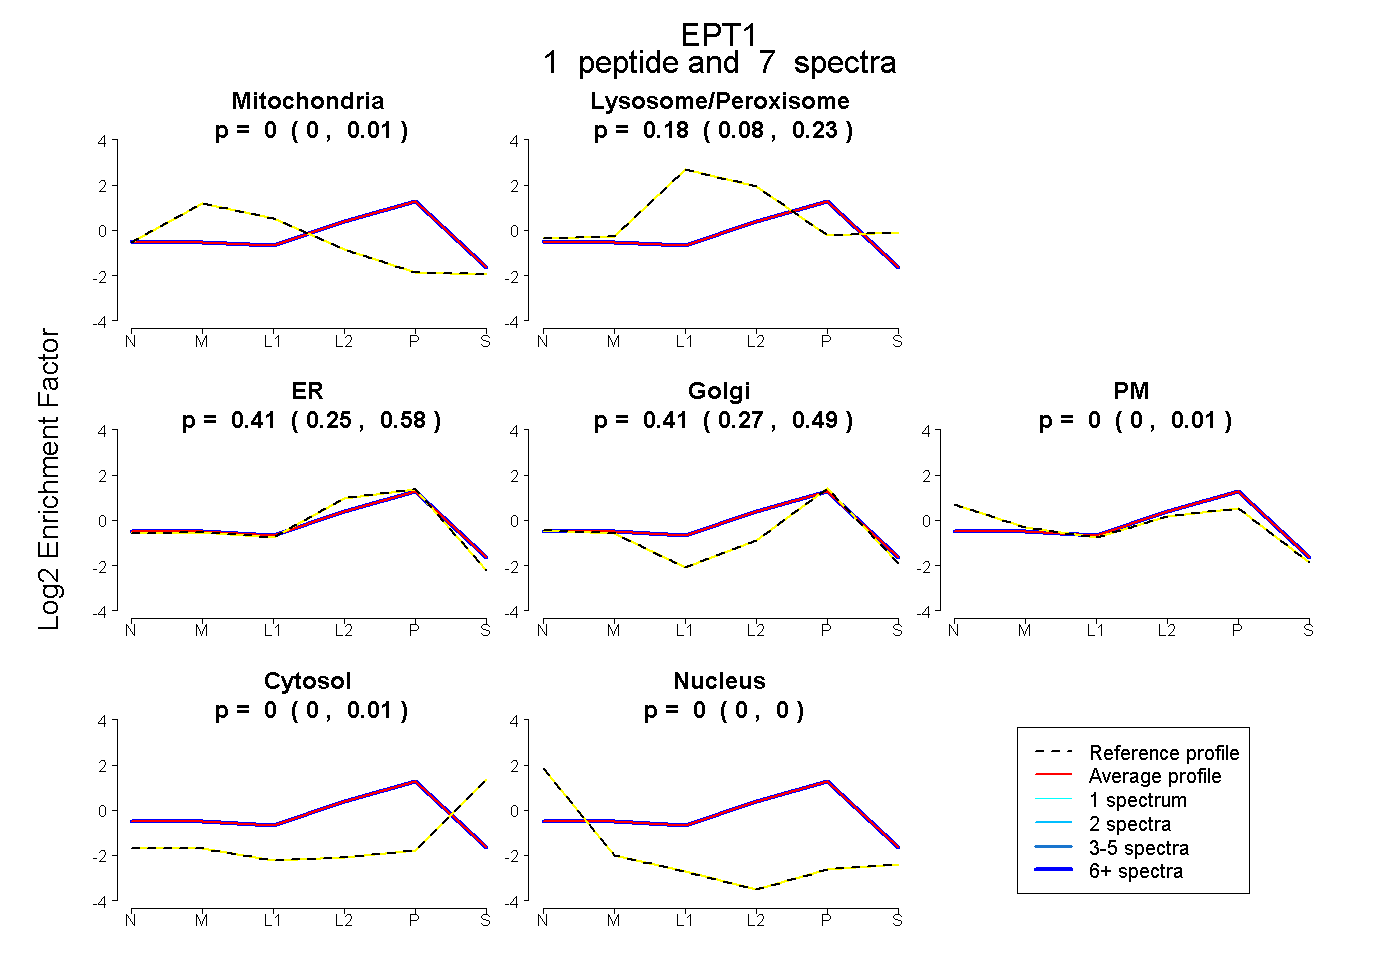 |
0.000 0.000 | 0.006 |
0.177 0.084 | 0.234 |
0.413 0.253 | 0.575 |
0.410 0.268 | 0.491 |
0.000 0.000 | 0.015 |
0.000 0.000 | 0.008 |
0.000 0.000 | 0.000 |
|||
| Plot | Lyso | Other | |||||||||||
| Expt C |
2 peptides |
16 spectra |
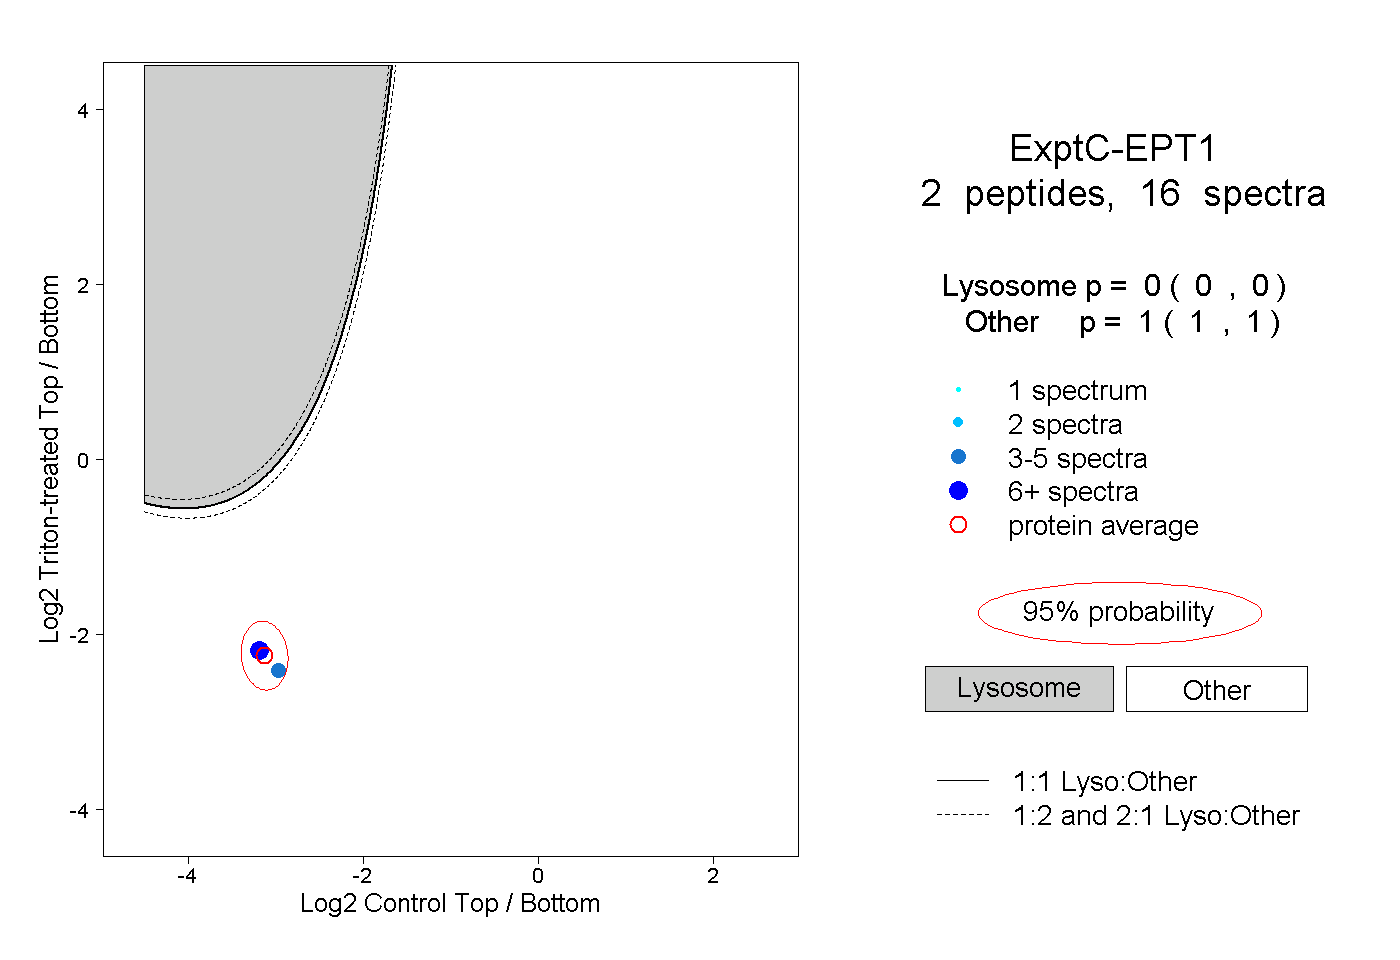 |
0.000 0.000 | 0.000 |
1.000 1.000 | 1.000 |
||||||||
| Plot | Lyso | Other | |||||||||||
| Expt D |
1 peptide |
1 spectrum |
 |
0.000 NA | NA |
1.000 NA | NA |