 5
5peptides
spectra
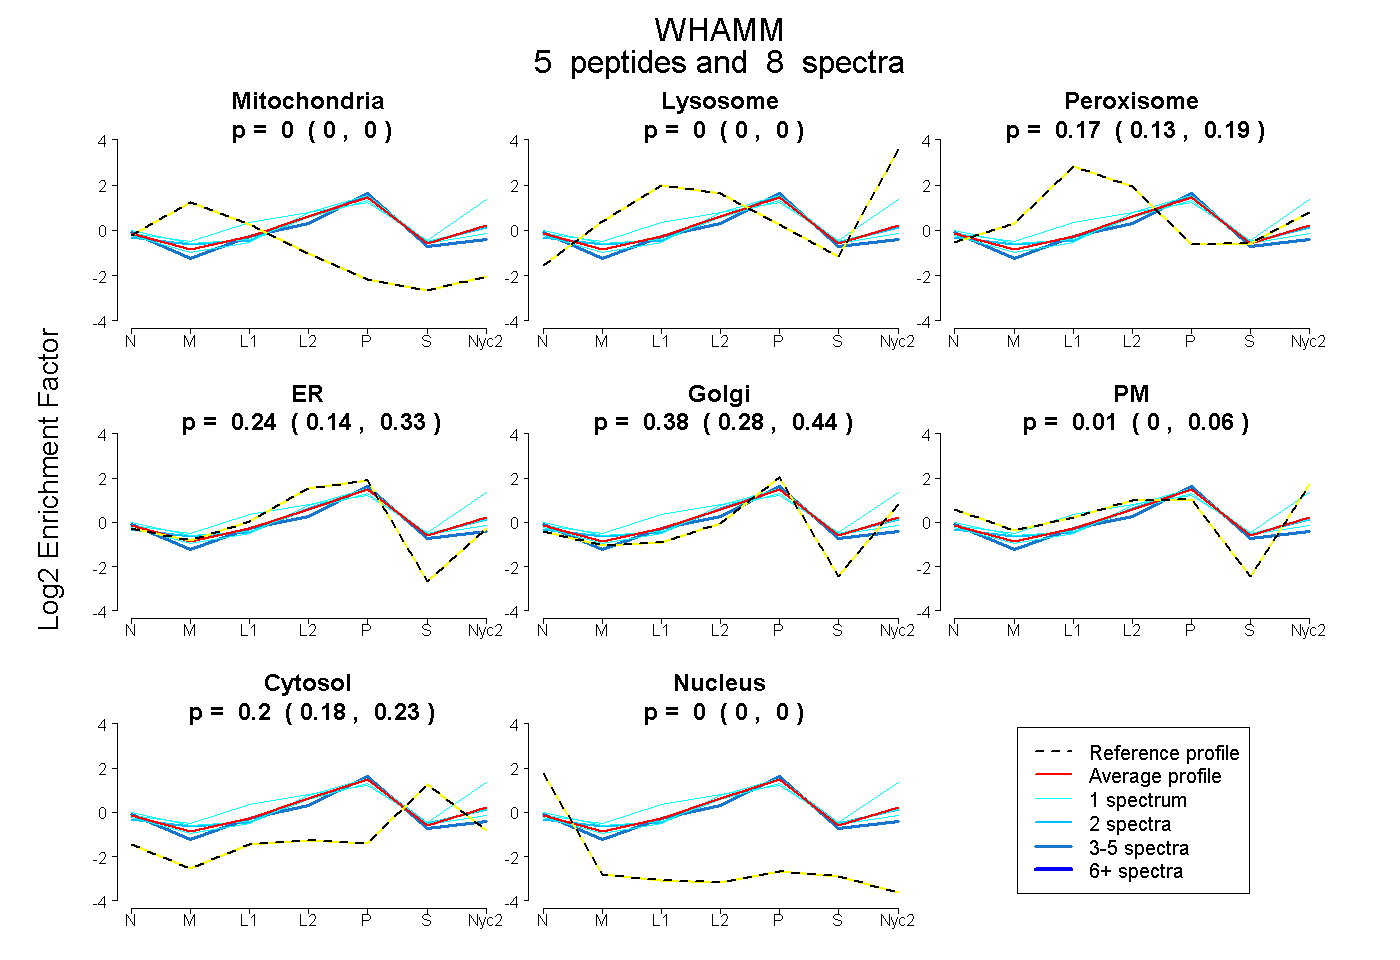
0.000 | 0.000
0.000 | 0.000
0.129 | 0.194
0.144 | 0.328
0.284 | 0.436
0.000 | 0.059
0.182 | 0.227
0.000 | 0.000
1peptide
spectrum
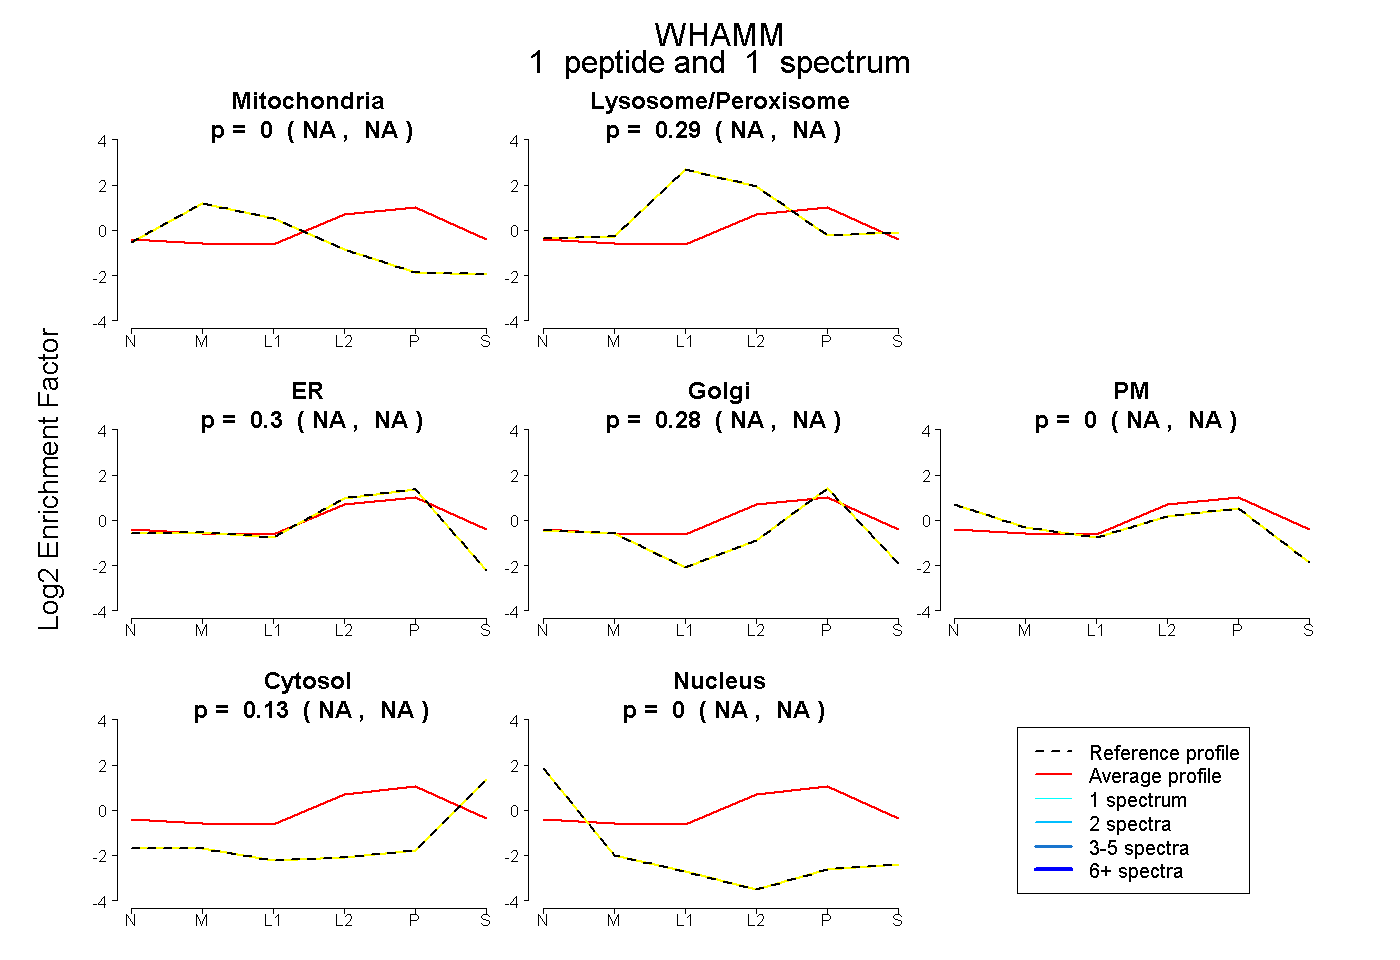
NA | NA
NA | NA
NA | NA
NA | NA
NA | NA
NA | NA
NA | NA
2peptides
spectra
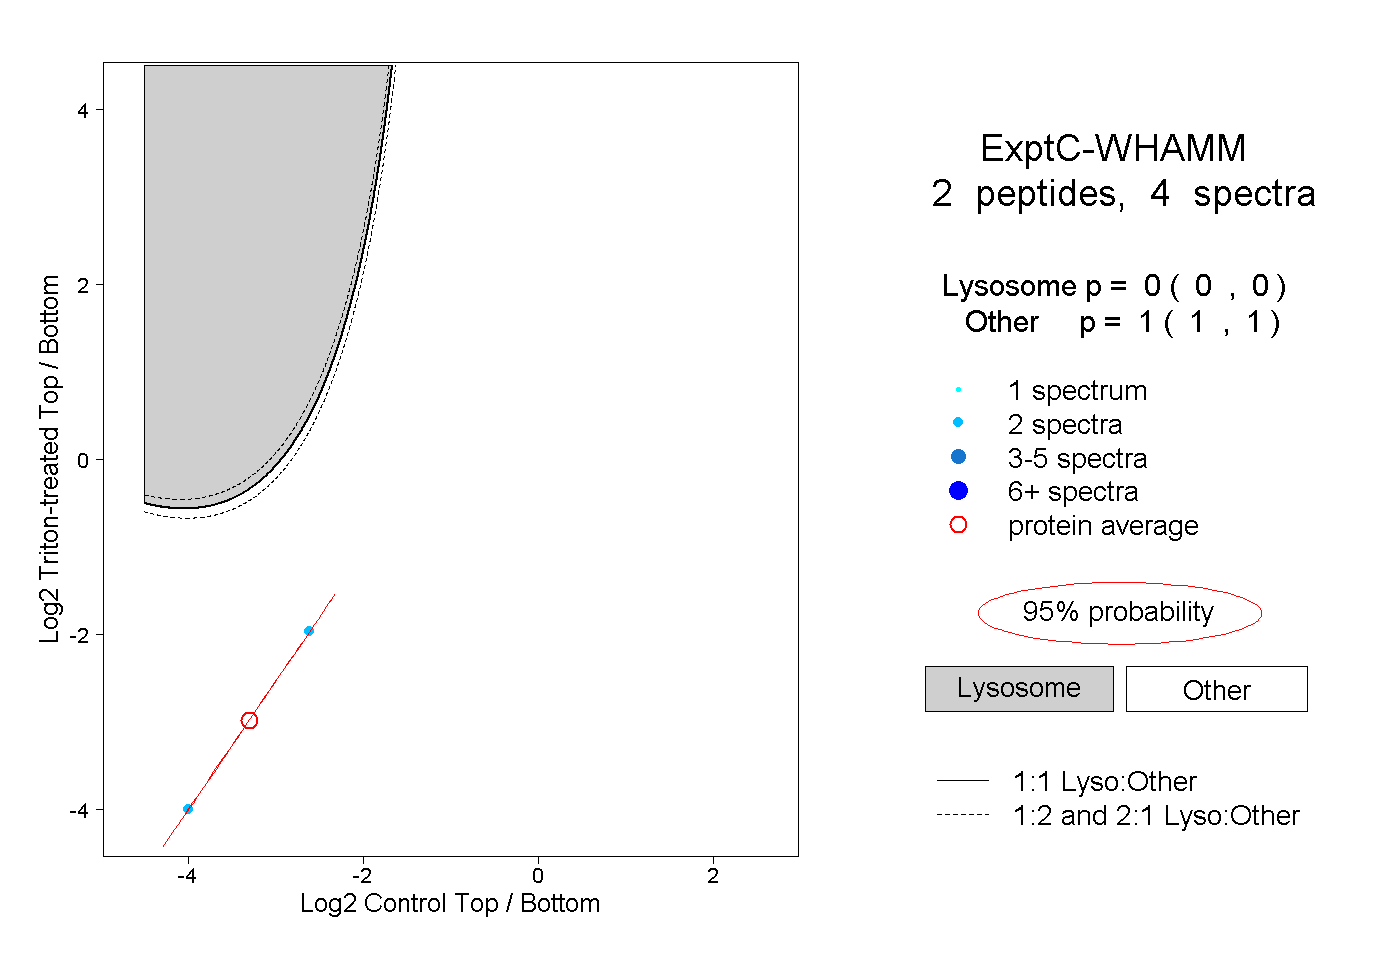
0.000 | 0.000
1.000 | 1.000