 5
5peptides
spectra
0.000 | 0.000
0.000 | 0.000
0.129 | 0.194
0.144 | 0.328
0.284 | 0.436
0.000 | 0.059
0.182 | 0.227
0.000 | 0.000
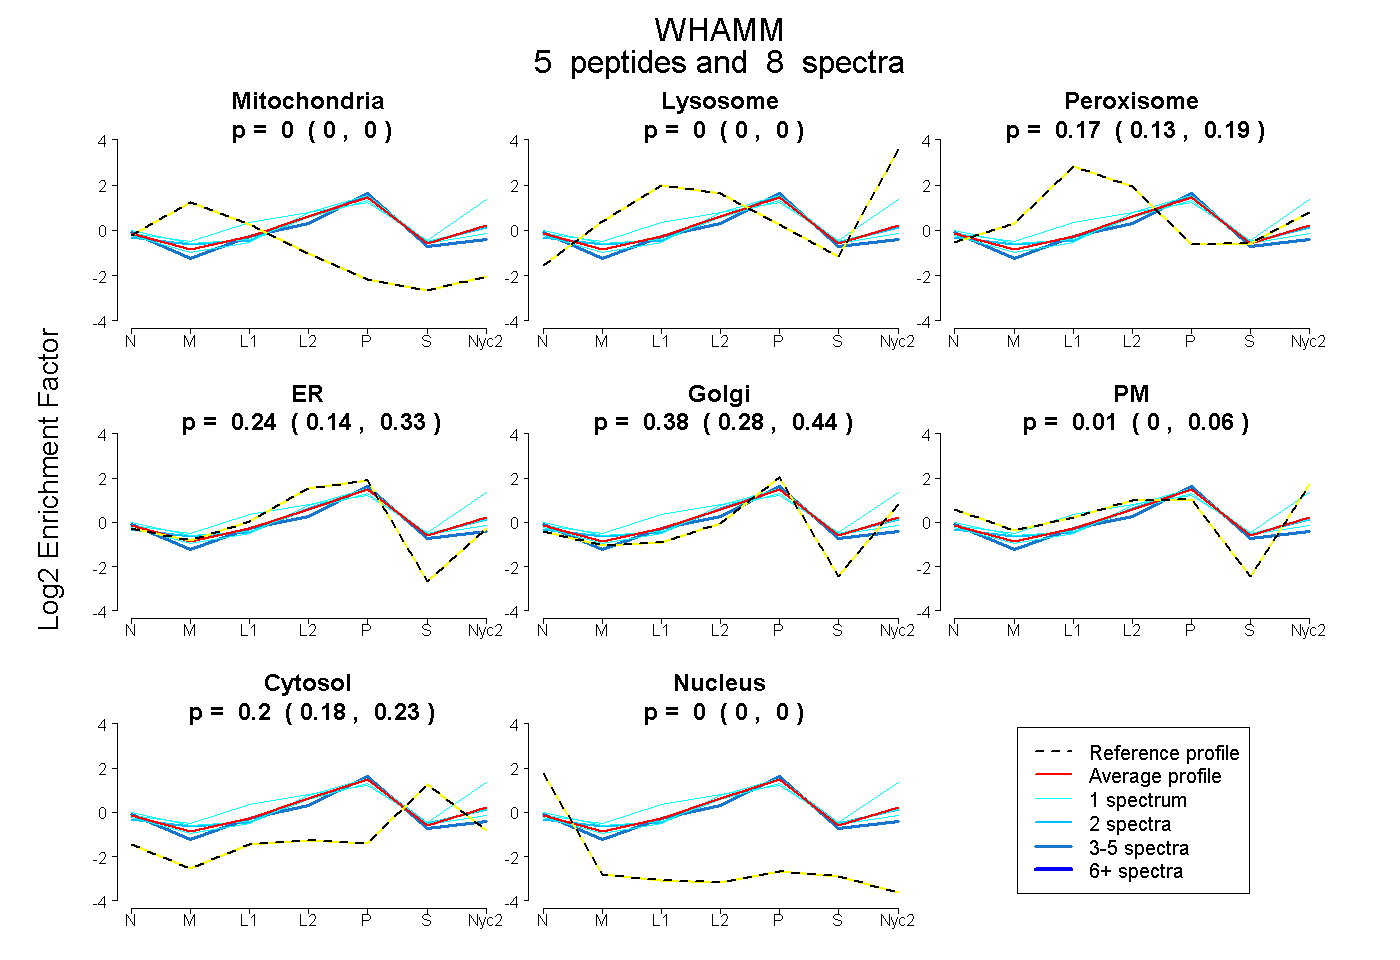
| Plot | Mito | Lyso | Perox | ER | Golgi | PM | Cytosol | Nucleus | |||||
| Expt A |
5 peptides |
8 spectra |
|
0.000 0.000 | 0.000 |
0.000 0.000 | 0.000 |
0.168 0.129 | 0.194 |
0.245 0.144 | 0.328 |
0.376 0.284 | 0.436 |
0.007 0.000 | 0.059 |
0.205 0.182 | 0.227 |
0.000 0.000 | 0.000 |
| 1 spectrum, SLAPDLELHLGDNR | 0.000 | 0.000 | 0.095 | 0.395 | 0.160 | 0.085 | 0.265 | 0.000 | ||
| 2 spectra, EASEWTR | 0.000 | 0.000 | 0.157 | 0.258 | 0.370 | 0.000 | 0.215 | 0.000 | ||
| 3 spectra, EWIDHER | 0.000 | 0.000 | 0.026 | 0.498 | 0.193 | 0.000 | 0.282 | 0.000 | ||
| 1 spectrum, SLEEDELGPK | 0.000 | 0.172 | 0.179 | 0.000 | 0.285 | 0.220 | 0.145 | 0.000 | ||
| 1 spectrum, NEETILVTR | 0.000 | 0.023 | 0.067 | 0.386 | 0.231 | 0.039 | 0.254 | 0.000 |
| Plot | Mito | Lyso or Perox | ER | Golgi | PM | Cytosol | Nucleus | ||||||
| Expt B |
1 peptide |
1 spectrum |
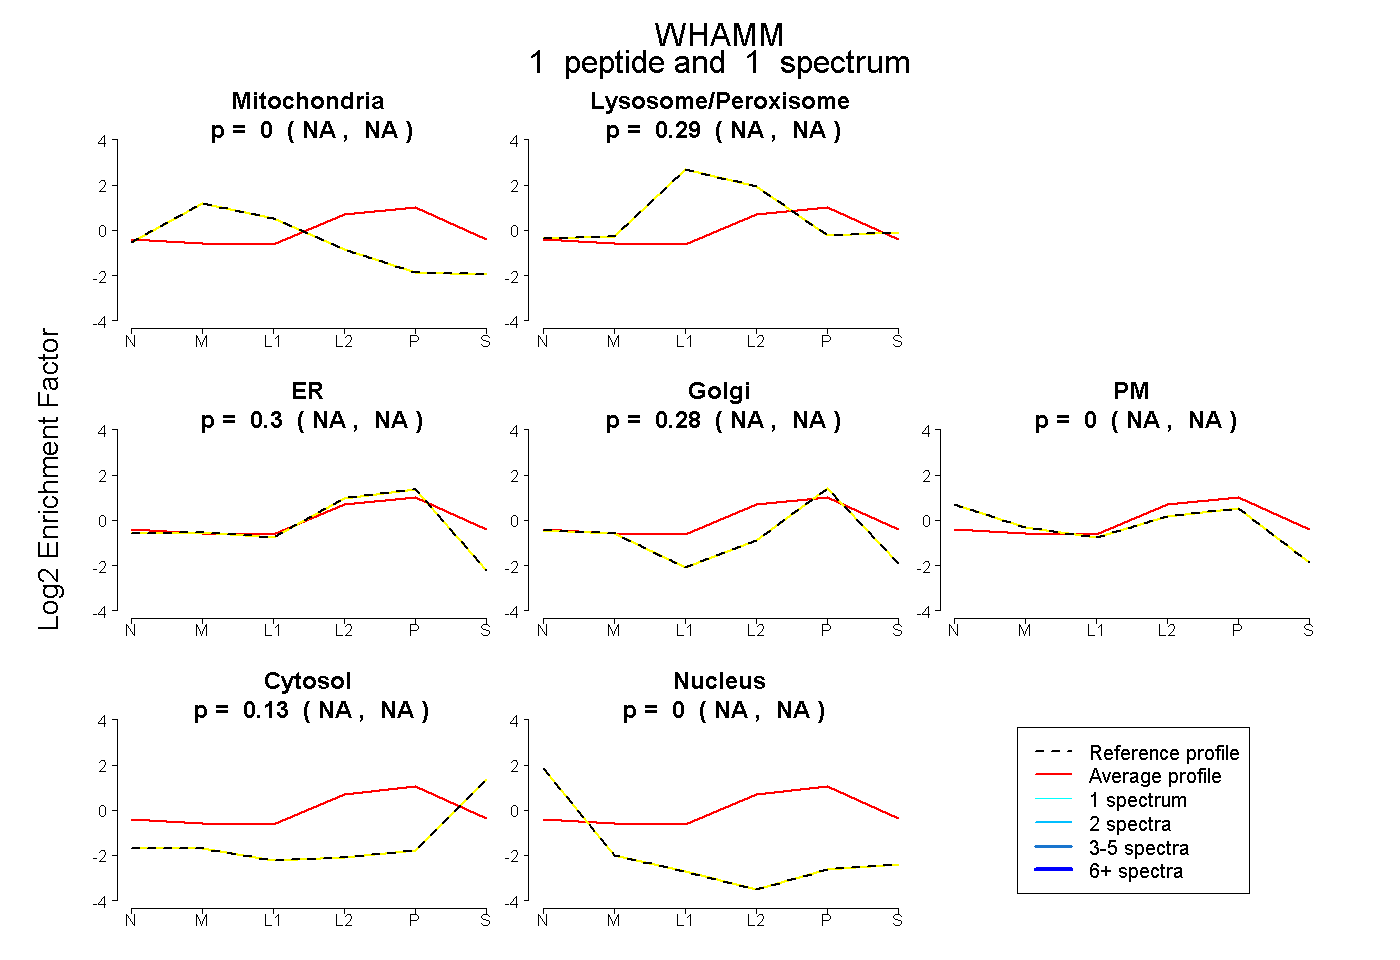 |
0.000 NA | NA |
0.288 NA | NA |
0.303 NA | NA |
0.282 NA | NA |
0.000 NA | NA |
0.126 NA | NA |
0.000 NA | NA |
|||
| Plot | Lyso | Other | |||||||||||
| Expt C |
2 peptides |
4 spectra |
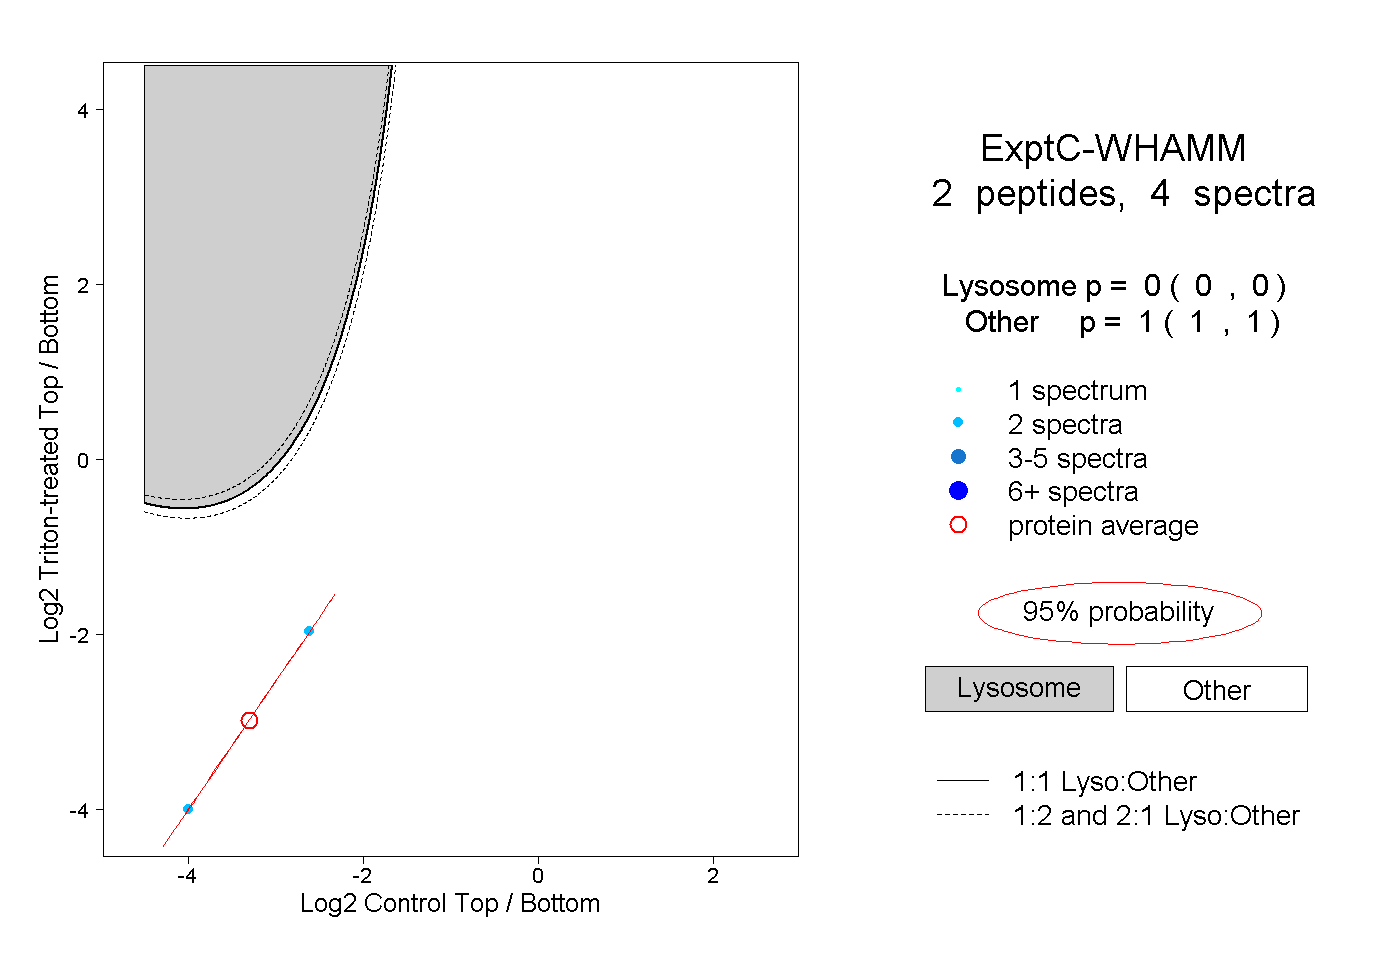 |
0.000 0.000 | 0.000 |
1.000 1.000 | 1.000 |