 15
15peptides
spectra
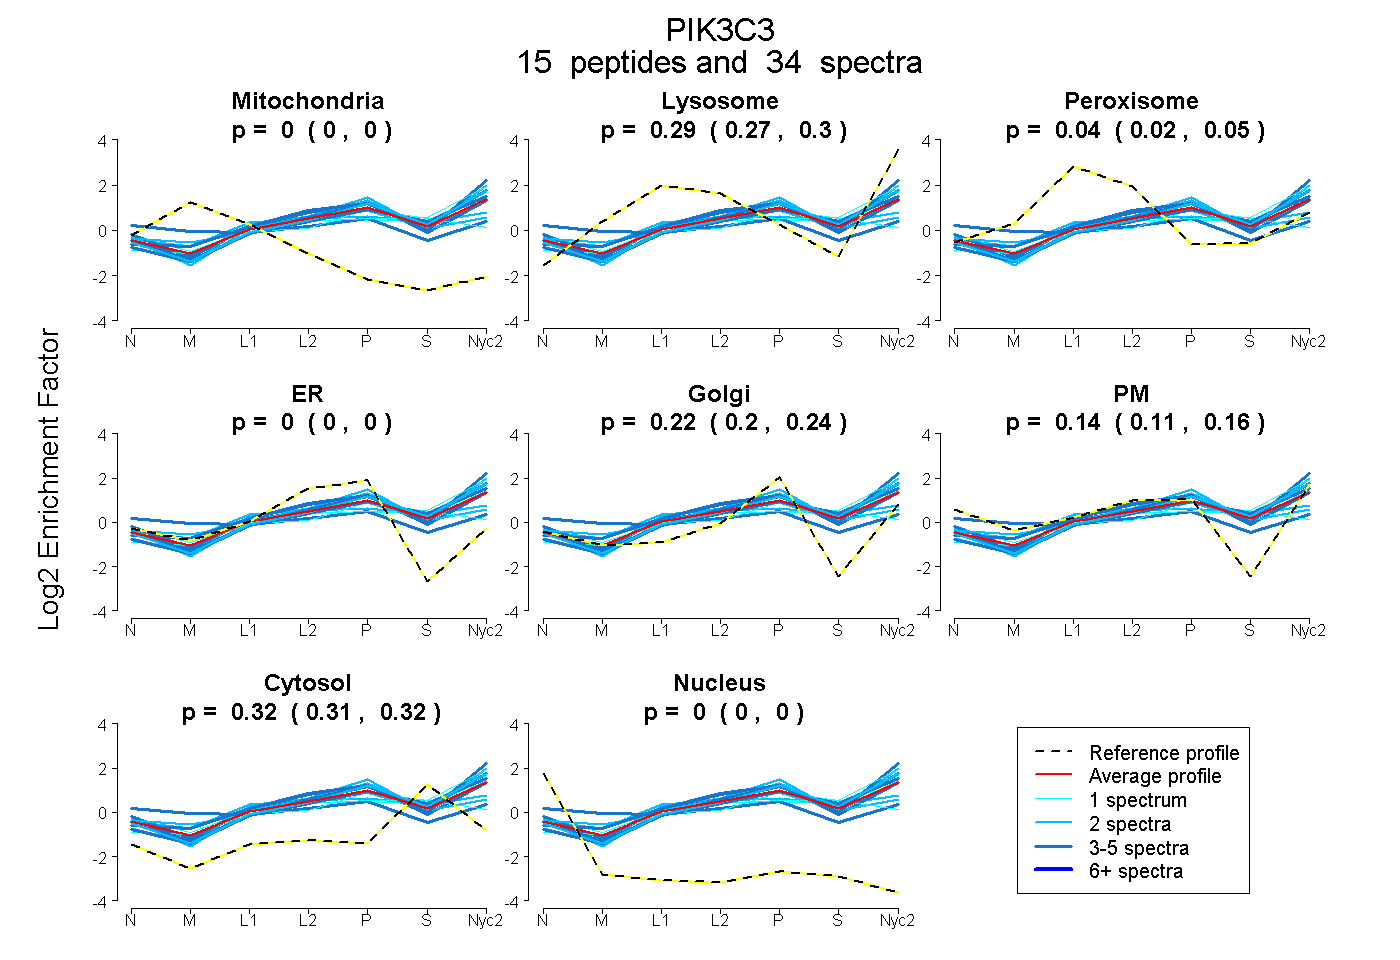
0.000 | 0.000
0.272 | 0.301
0.020 | 0.054
0.000 | 0.000
0.200 | 0.239
0.114 | 0.157
0.310 | 0.321
0.000 | 0.000
1peptide
spectra
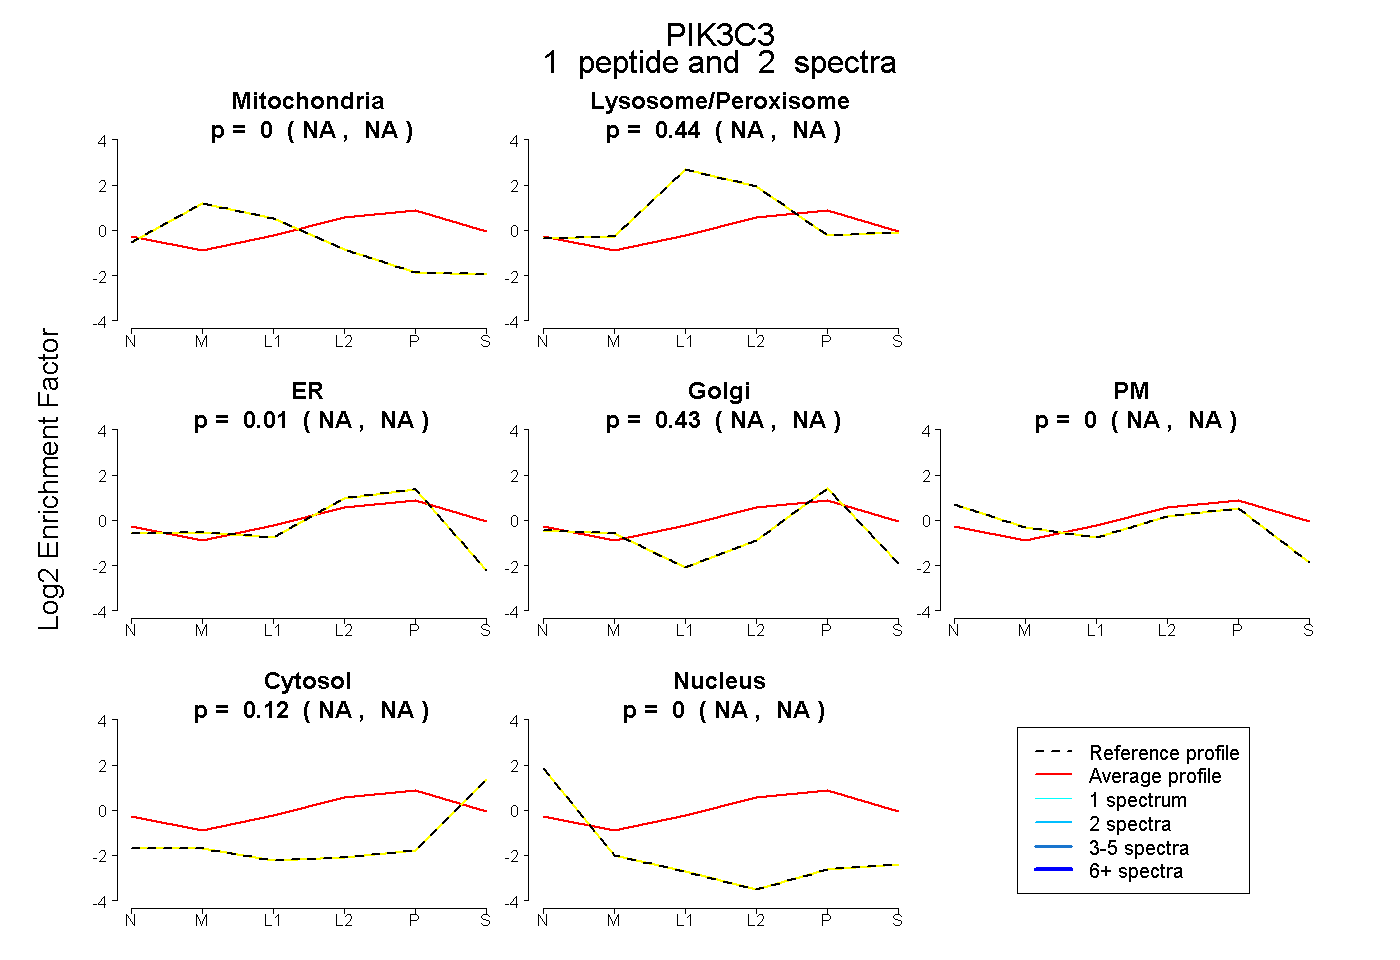
NA | NA
NA | NA
NA | NA
NA | NA
NA | NA
NA | NA
NA | NA
16peptides
spectra
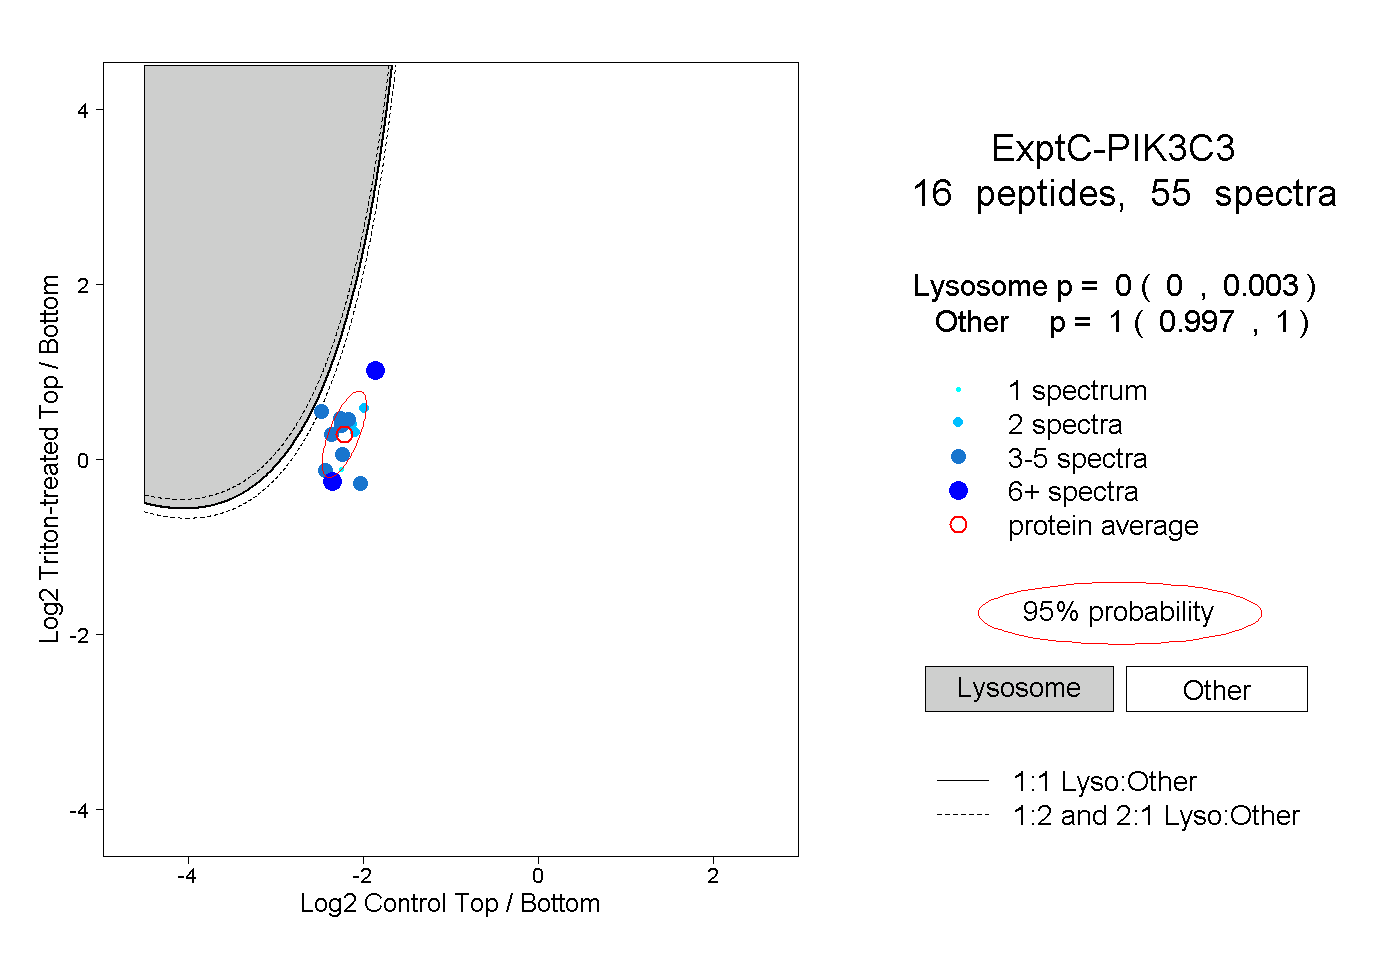
0.000 | 0.003
0.997 | 1.000
4peptides
spectra
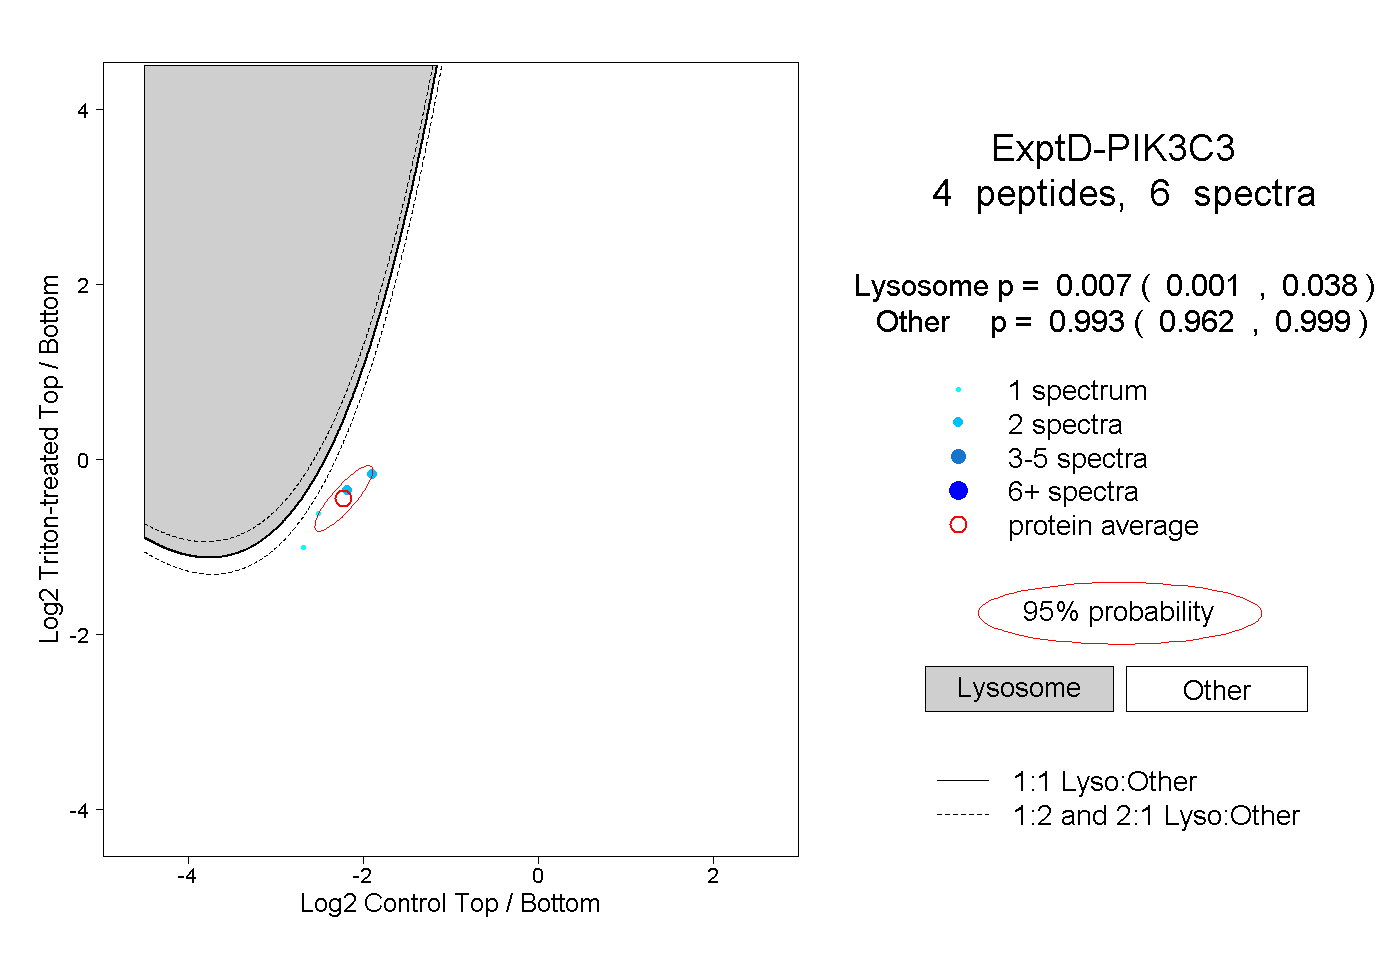
0.001 | 0.038
0.962 | 0.999