 15
15peptides
spectra
0.000 | 0.000
0.272 | 0.301
0.020 | 0.054
0.000 | 0.000
0.200 | 0.239
0.114 | 0.157
0.310 | 0.321
0.000 | 0.000
| Plot | Mito | Lyso | Perox | ER | Golgi | PM | Cytosol | Nucleus | |||||
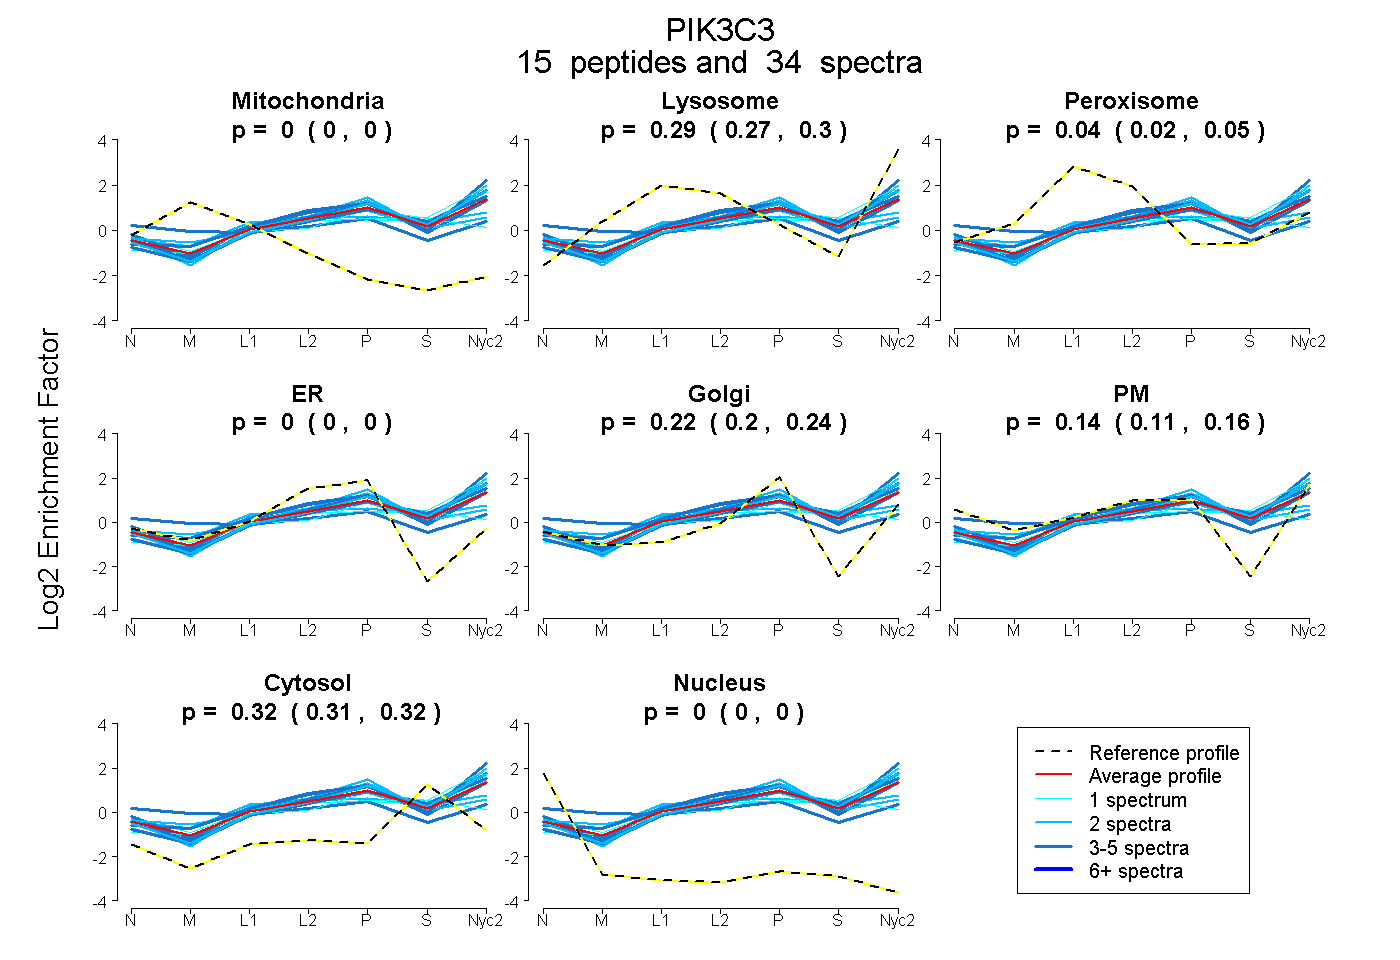
| Expt A |
15 peptides |
34 spectra |
|
0.000 0.000 | 0.000 |
0.287 0.272 | 0.301 |
0.039 0.020 | 0.054 |
0.000 0.000 | 0.000 |
0.222 0.200 | 0.239 |
0.137 0.114 | 0.157 |
0.315 0.310 | 0.321 |
0.000 0.000 | 0.000 |
| 4 spectra, LQALLGDNEK | 0.000 | 0.245 | 0.010 | 0.109 | 0.096 | 0.266 | 0.274 | 0.000 | ||
| 2 spectra, SLLAAQQTFVDR | 0.000 | 0.275 | 0.000 | 0.038 | 0.245 | 0.133 | 0.309 | 0.000 | ||
| 1 spectrum, EIEMINESEK | 0.000 | 0.334 | 0.000 | 0.000 | 0.000 | 0.274 | 0.391 | 0.000 | ||
| 2 spectra, AVPVGGTTVSLFGK | 0.000 | 0.420 | 0.000 | 0.000 | 0.342 | 0.000 | 0.238 | 0.000 | ||
| 2 spectra, QCYTAFLHLR | 0.000 | 0.052 | 0.281 | 0.000 | 0.381 | 0.014 | 0.272 | 0.000 | ||
| 3 spectra, TSSTLSEDQMSR | 0.000 | 0.488 | 0.000 | 0.000 | 0.263 | 0.044 | 0.205 | 0.000 | ||
| 3 spectra, LGSIEGK | 0.069 | 0.000 | 0.171 | 0.000 | 0.120 | 0.382 | 0.257 | 0.000 | ||
| 2 spectra, YPDLPR | 0.000 | 0.365 | 0.000 | 0.000 | 0.310 | 0.013 | 0.312 | 0.000 | ||
| 1 spectrum, AVLEDPMLK | 0.000 | 0.347 | 0.005 | 0.026 | 0.229 | 0.086 | 0.308 | 0.000 | ||
| 4 spectra, YENFDDIK | 0.000 | 0.363 | 0.000 | 0.000 | 0.263 | 0.000 | 0.374 | 0.000 | ||
| 1 spectrum, SALMPAQLFFK | 0.000 | 0.033 | 0.242 | 0.000 | 0.324 | 0.000 | 0.401 | 0.000 | ||
| 3 spectra, VDWLDR | 0.000 | 0.344 | 0.000 | 0.000 | 0.274 | 0.080 | 0.301 | 0.000 | ||
| 2 spectra, EMVEGMGGTQSEQYQEFR | 0.000 | 0.119 | 0.298 | 0.000 | 0.225 | 0.047 | 0.310 | 0.000 | ||
| 1 spectrum, VWPNVEADGSEPTR | 0.000 | 0.387 | 0.000 | 0.000 | 0.002 | 0.211 | 0.400 | 0.000 | ||
| 3 spectra, LVHLMK | 0.000 | 0.282 | 0.065 | 0.000 | 0.310 | 0.063 | 0.280 | 0.000 |
| Plot | Mito | Lyso or Perox | ER | Golgi | PM | Cytosol | Nucleus | ||||||
| Expt B |
1 peptide |
2 spectra |
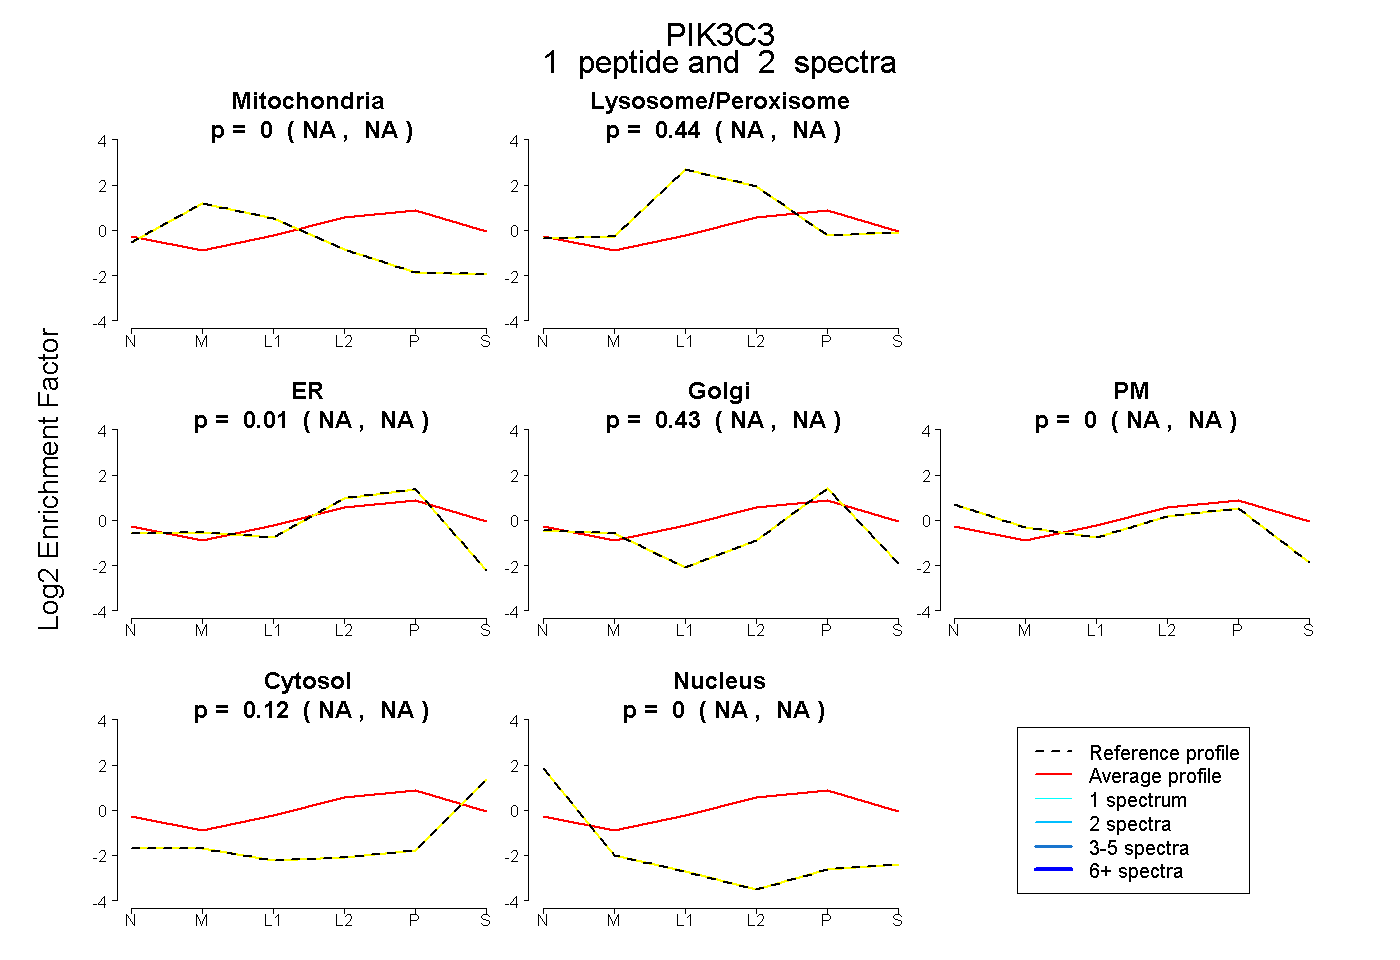 |
0.000 NA | NA |
0.440 NA | NA |
0.012 NA | NA |
0.431 NA | NA |
0.000 NA | NA |
0.118 NA | NA |
0.000 NA | NA |
|||
| Plot | Lyso | Other | |||||||||||
| Expt C |
16 peptides |
55 spectra |
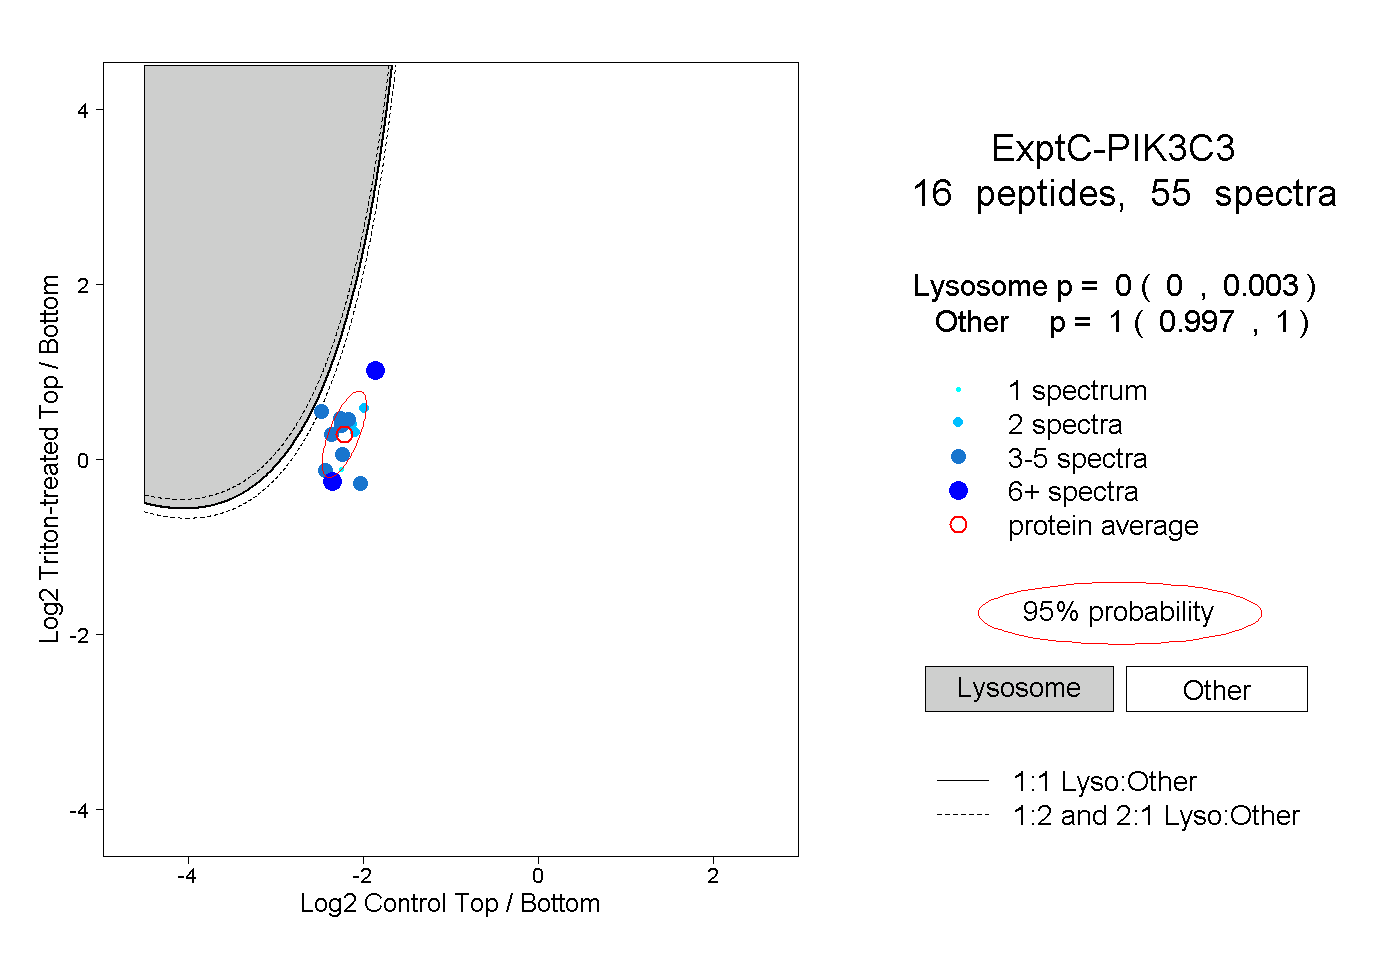 |
0.000 0.000 | 0.003 |
1.000 0.997 | 1.000 |
||||||||
| Plot | Lyso | Other | |||||||||||
| Expt D |
4 peptides |
6 spectra |
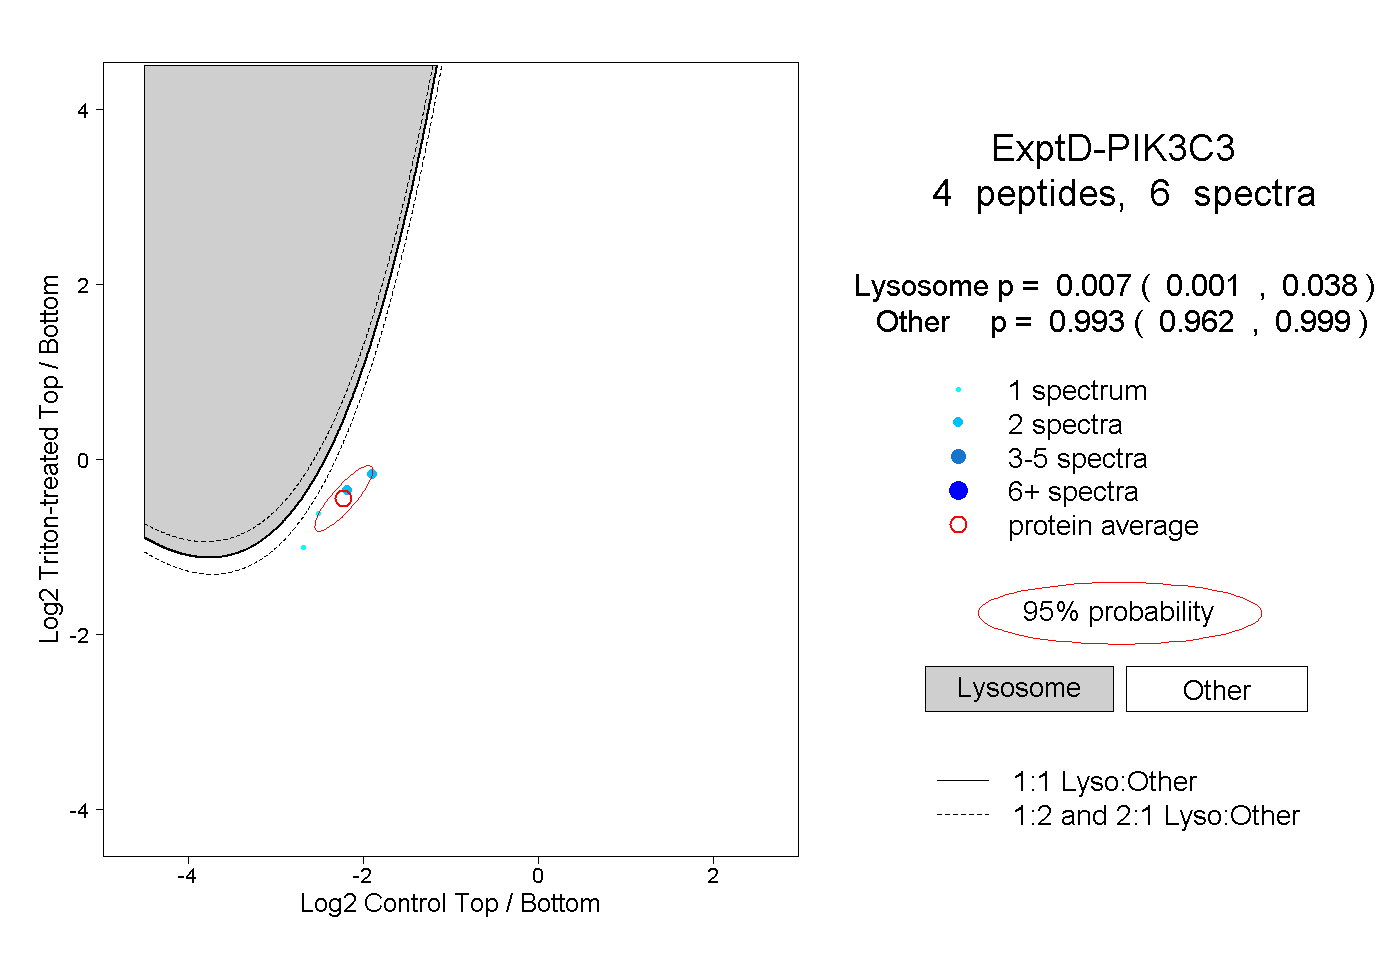 |
0.007 0.001 | 0.038 |
0.993 0.962 | 0.999 |