 5
5peptides
spectra
0.000 | 0.013
0.092 | 0.184
0.000 | 0.077
0.000 | 0.000
0.000 | 0.000
0.217 | 0.264
0.548 | 0.594
0.000 | 0.000
3peptides
spectra
0.000 | 0.000
1.000 | 1.000
| Plot | Mito | Lyso | Perox | ER | Golgi | PM | Cytosol | Nucleus | |||||
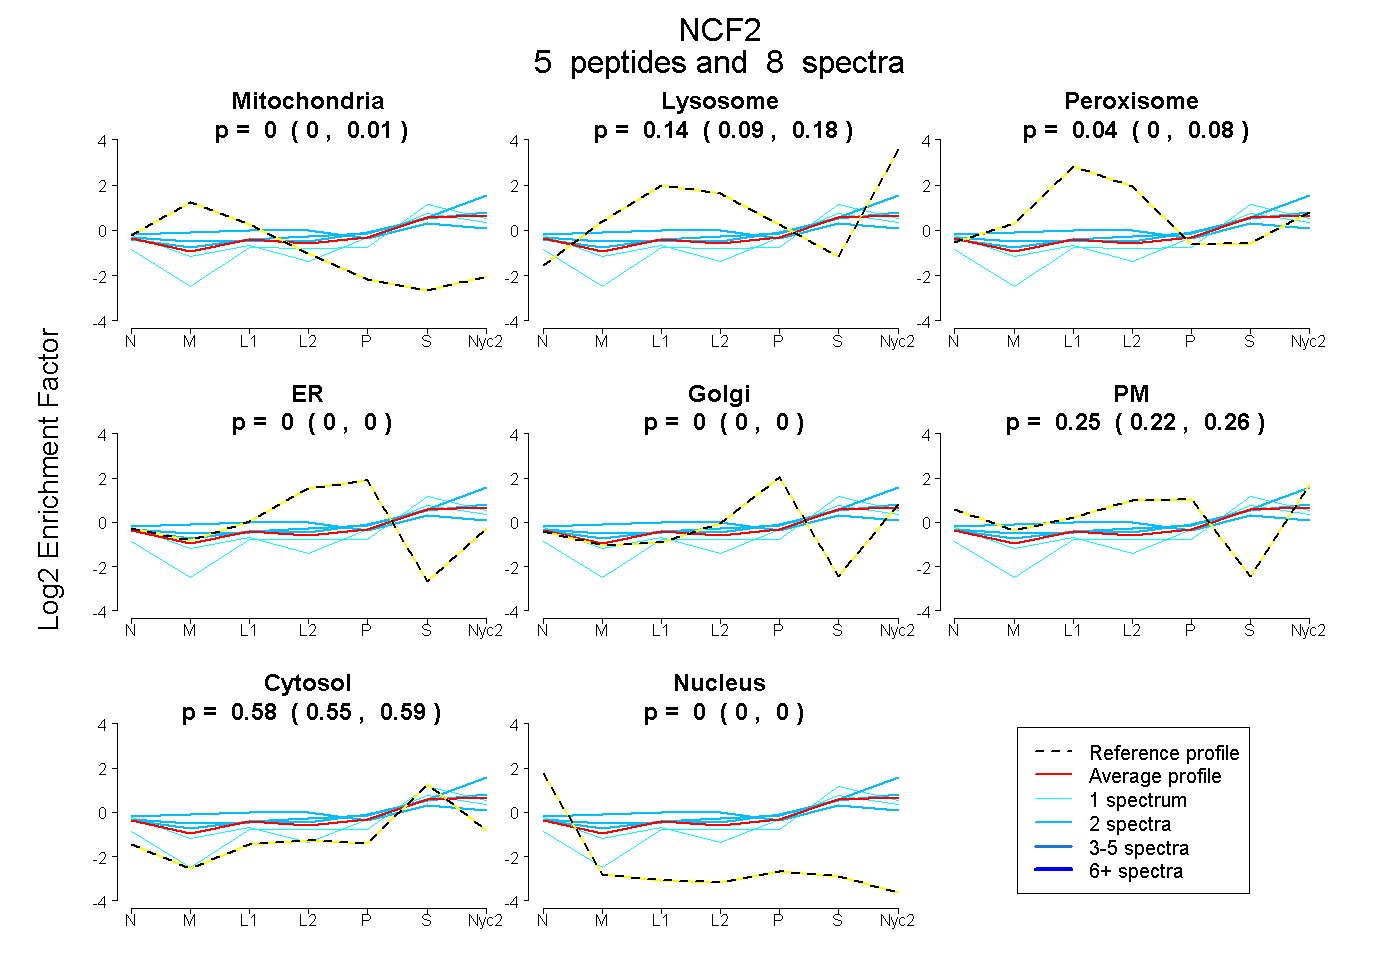
| Expt A |
5 peptides |
8 spectra |
|
0.000 0.000 | 0.013 |
0.142 0.092 | 0.184 |
0.037 0.000 | 0.077 |
0.000 0.000 | 0.000 |
0.000 0.000 | 0.000 |
0.245 0.217 | 0.264 |
0.575 0.548 | 0.594 |
0.000 0.000 | 0.000 |
||
| Plot | Lyso | Other | |||||||||||
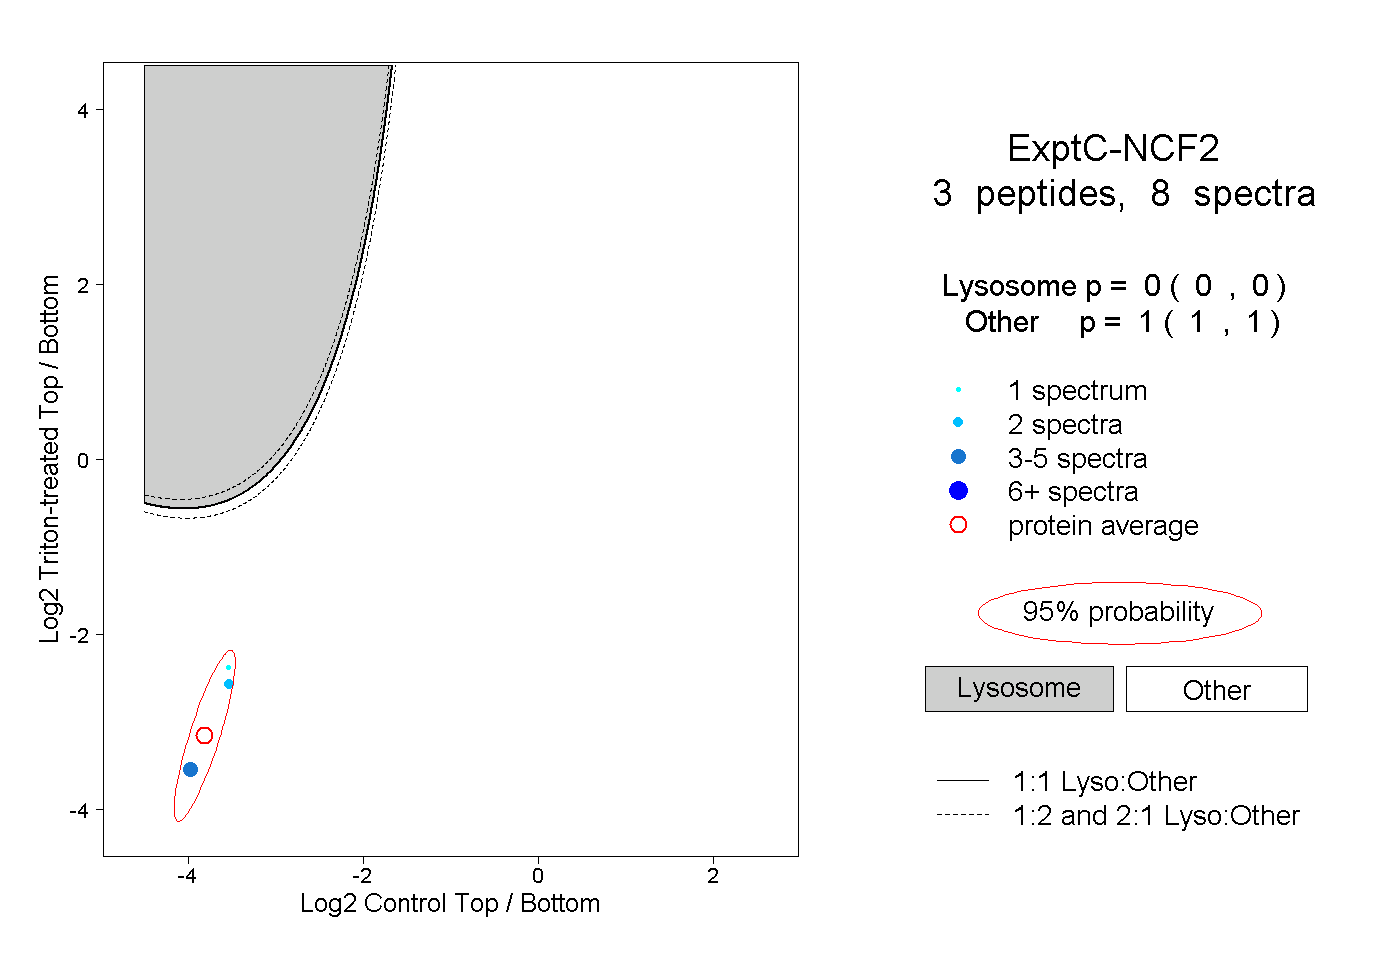
| Expt C |
3 peptides |
8 spectra |
|
0.000 0.000 | 0.000 |
1.000 1.000 | 1.000 |