 5
5peptides
spectra
0.000 | 0.013
0.092 | 0.184
0.000 | 0.077
0.000 | 0.000
0.000 | 0.000
0.217 | 0.264
0.548 | 0.594
0.000 | 0.000
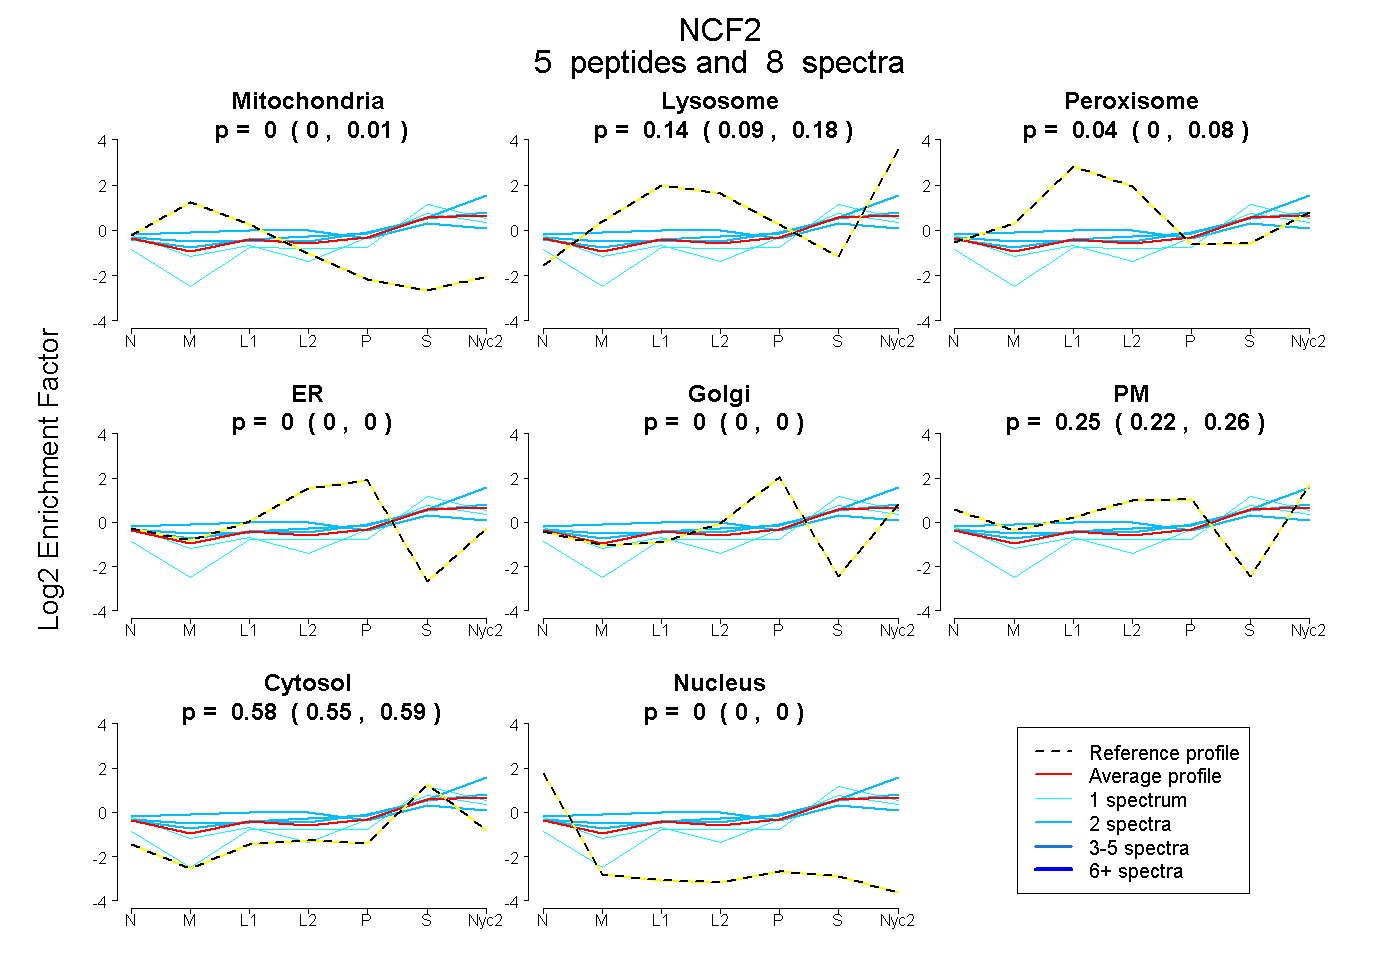
| Plot | Mito | Lyso | Perox | ER | Golgi | PM | Cytosol | Nucleus | |||||
| Expt A |
5 peptides |
8 spectra |
|
0.000 0.000 | 0.013 |
0.142 0.092 | 0.184 |
0.037 0.000 | 0.077 |
0.000 0.000 | 0.000 |
0.000 0.000 | 0.000 |
0.245 0.217 | 0.264 |
0.575 0.548 | 0.594 |
0.000 0.000 | 0.000 |
| 1 spectrum, GLVPCNYLEPVELR | 0.000 | 0.157 | 0.000 | 0.000 | 0.000 | 0.051 | 0.792 | 0.000 | ||
| 2 spectra, IGIFPK | 0.000 | 0.300 | 0.000 | 0.000 | 0.000 | 0.210 | 0.491 | 0.000 | ||
| 1 spectrum, DSPELLLLSEESMK | 0.000 | 0.040 | 0.000 | 0.000 | 0.000 | 0.286 | 0.673 | 0.000 | ||
| 2 spectra, GALEAFSEVQDPHSR | 0.013 | 0.186 | 0.011 | 0.000 | 0.000 | 0.270 | 0.520 | 0.000 | ||
| 2 spectra, ALEGEAHR | 0.092 | 0.000 | 0.282 | 0.000 | 0.000 | 0.219 | 0.407 | 0.000 |
| Plot | Lyso | Other | |||||||||||
| Expt C |
3 peptides |
8 spectra |
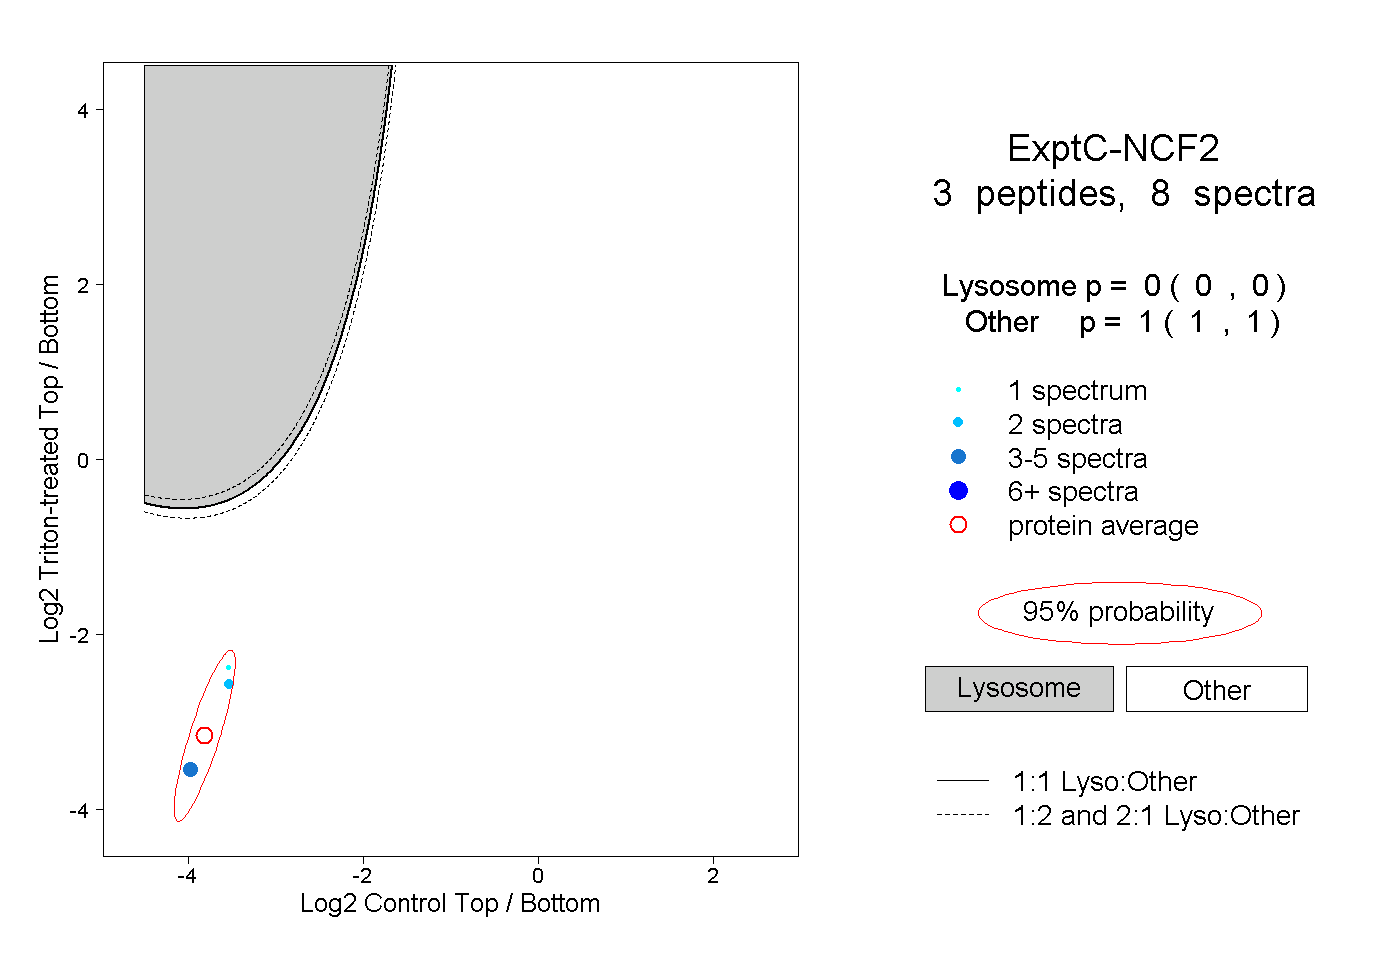 |
0.000 0.000 | 0.000 |
1.000 1.000 | 1.000 |