 9
9peptides
spectra
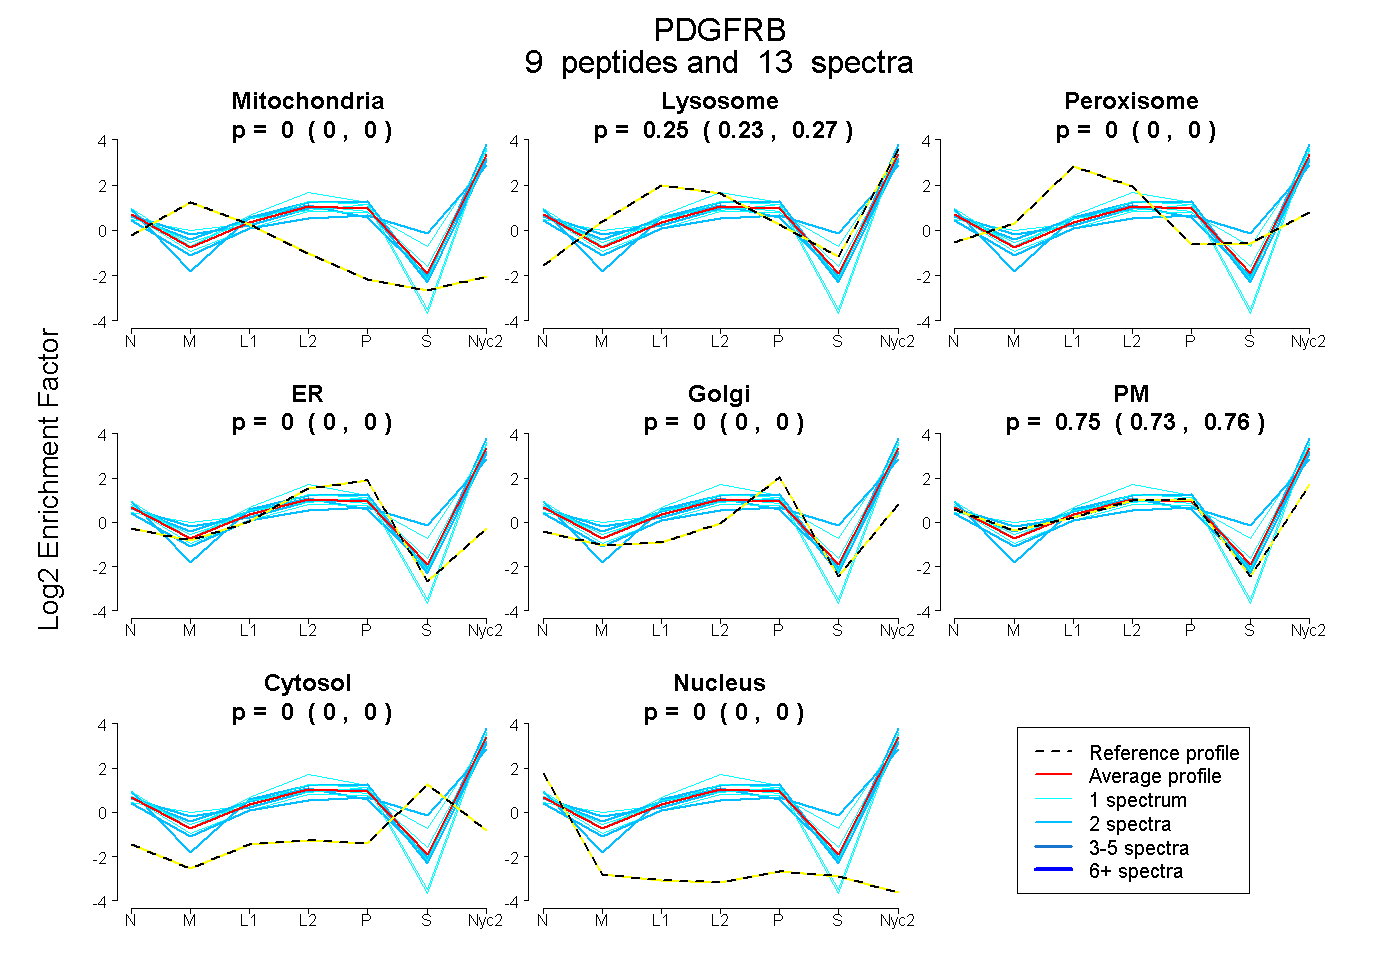
0.000 | 0.000
0.231 | 0.271
0.000 | 0.000
0.000 | 0.000
0.000 | 0.000
0.726 | 0.765
0.000 | 0.000
0.000 | 0.000
1peptide
spectra
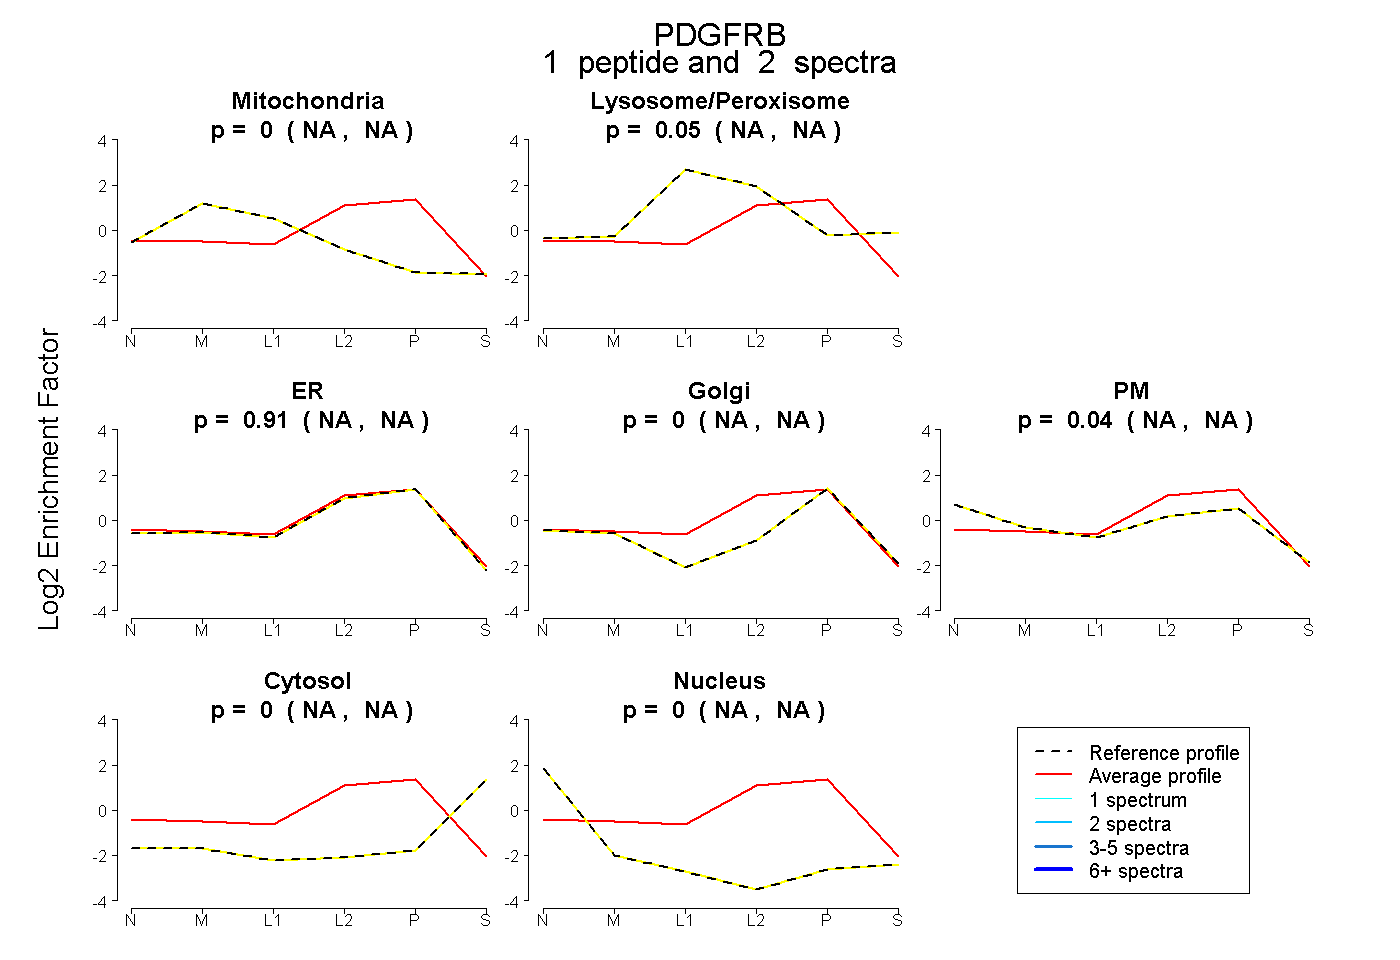
NA | NA
NA | NA
NA | NA
NA | NA
NA | NA
NA | NA
NA | NA
16peptides
spectra
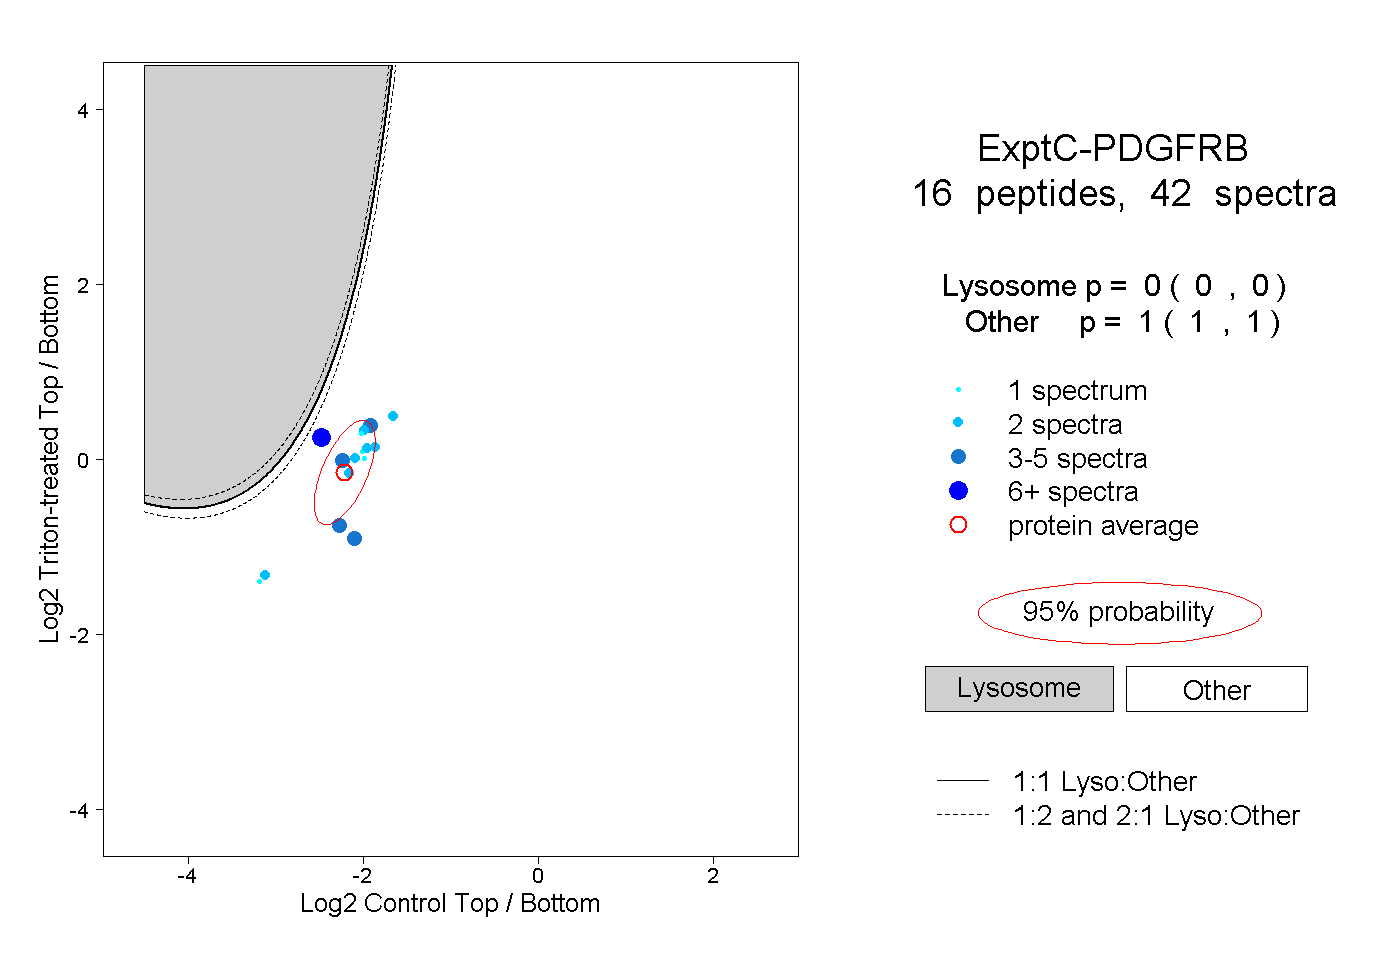
0.000 | 0.000
1.000 | 1.000
2peptides
spectra
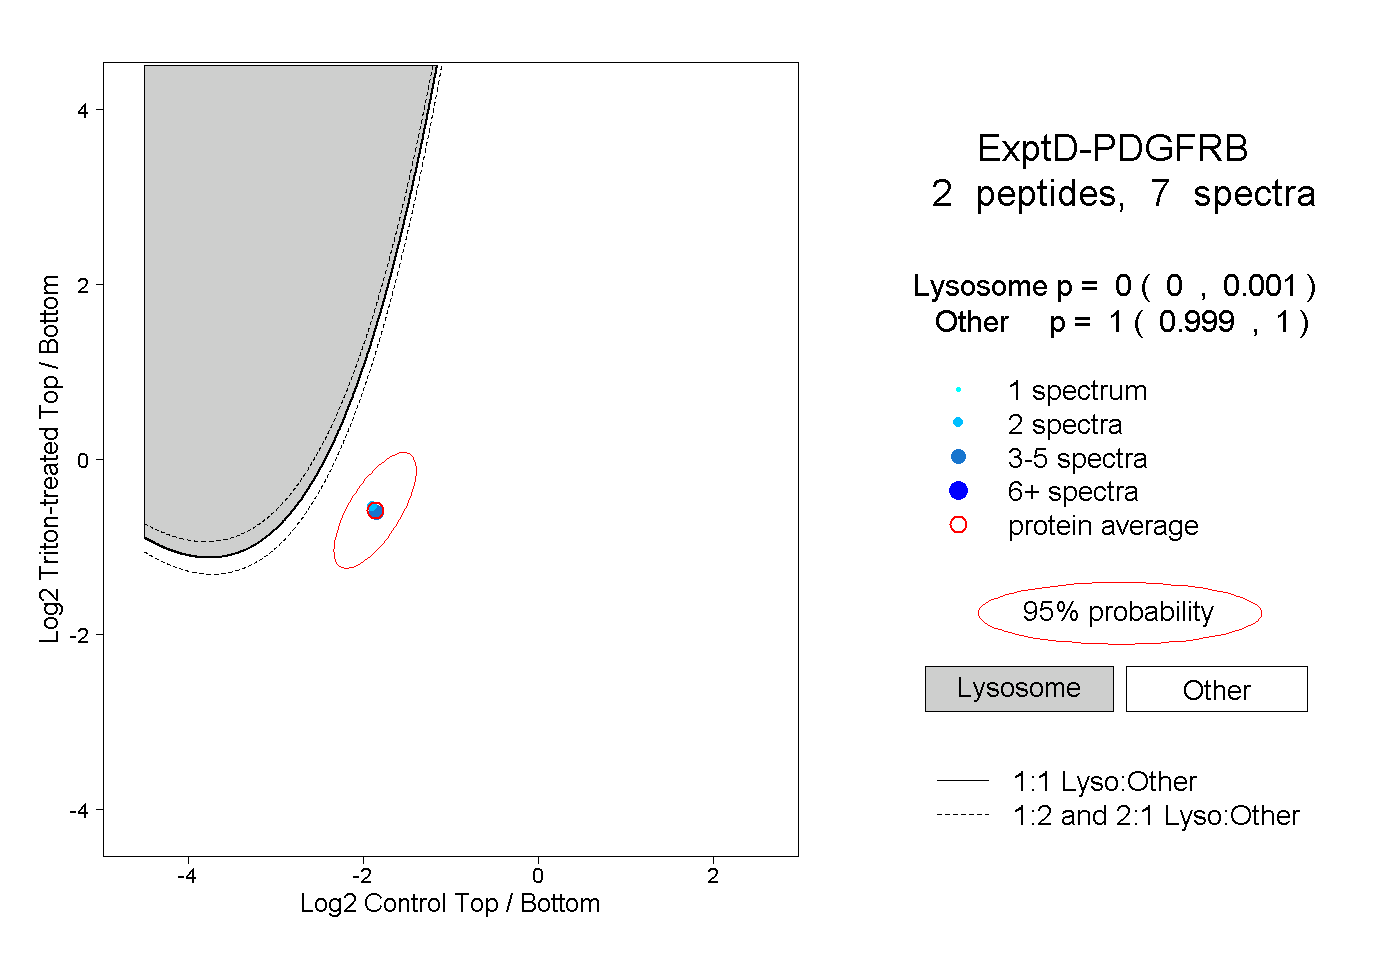
0.000 | 0.001
0.999 | 1.000