 9
9peptides
spectra
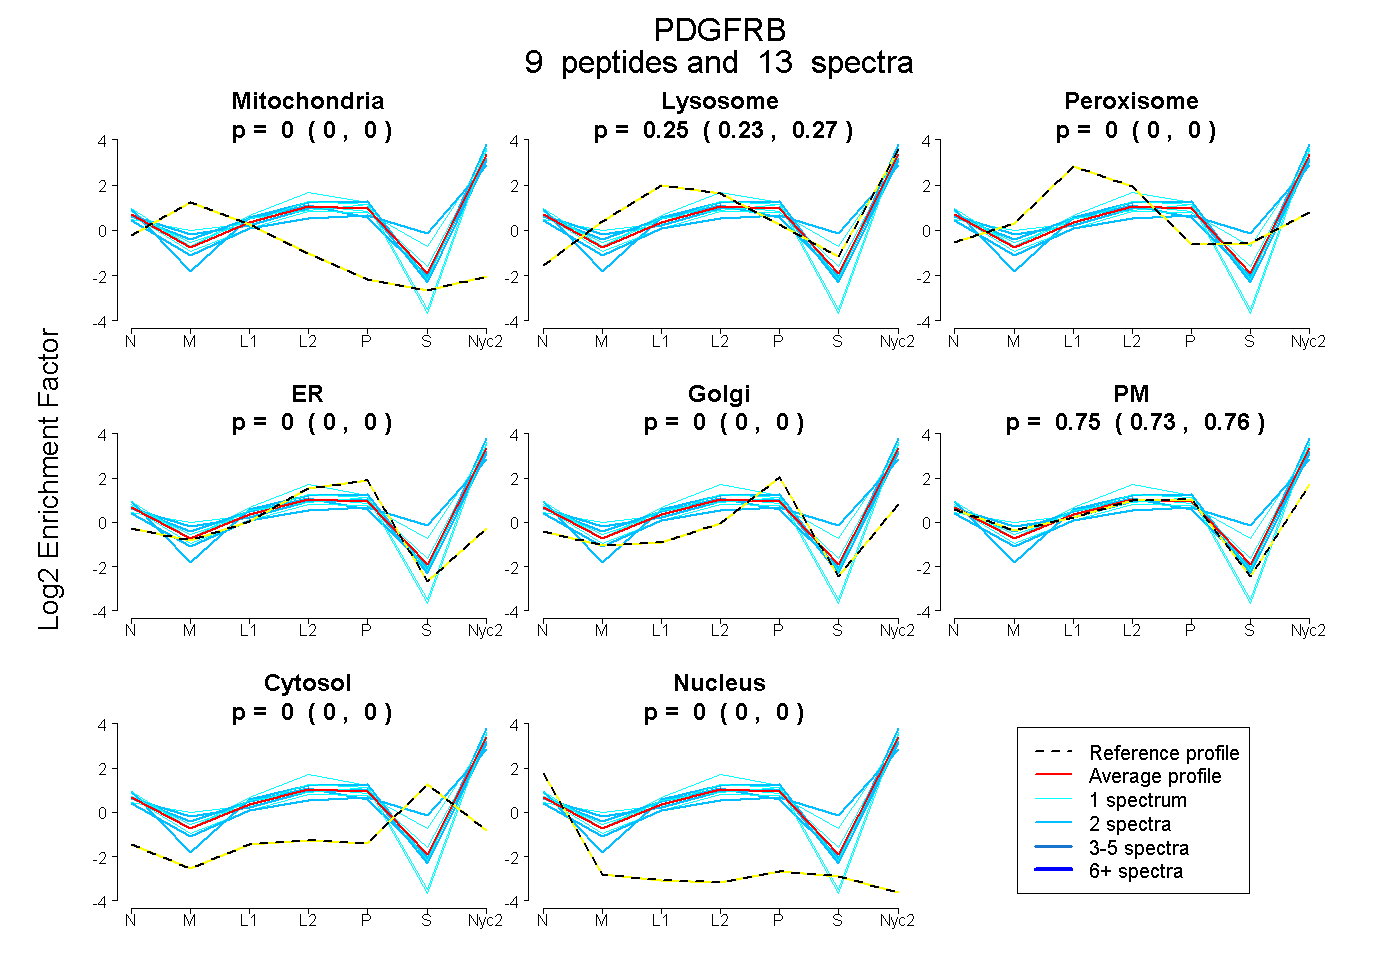
0.000 | 0.000
0.231 | 0.271
0.000 | 0.000
0.000 | 0.000
0.000 | 0.000
0.726 | 0.765
0.000 | 0.000
0.000 | 0.000
| Plot | Mito | Lyso | Perox | ER | Golgi | PM | Cytosol | Nucleus | |||||
| Expt A |
9 peptides |
13 spectra |
|
0.000 0.000 | 0.000 |
0.254 0.231 | 0.271 |
0.000 0.000 | 0.000 |
0.000 0.000 | 0.000 |
0.000 0.000 | 0.000 |
0.746 0.726 | 0.765 |
0.000 0.000 | 0.000 |
0.000 0.000 | 0.000 |
| 2 spectra, YGDLVDYLHR | 0.000 | 0.326 | 0.000 | 0.000 | 0.000 | 0.445 | 0.228 | 0.000 | ||
| 1 spectrum, QALMSELK | 0.000 | 0.306 | 0.000 | 0.000 | 0.000 | 0.587 | 0.108 | 0.000 | ||
| 2 spectra, LPGLHSLR | 0.000 | 0.206 | 0.000 | 0.000 | 0.000 | 0.794 | 0.000 | 0.000 | ||
| 1 spectrum, YQQVDEEFLR | 0.000 | 0.090 | 0.000 | 0.000 | 0.000 | 0.910 | 0.000 | 0.000 | ||
| 1 spectrum, TLGDSSAGELVLSTR | 0.000 | 0.258 | 0.000 | 0.000 | 0.000 | 0.742 | 0.000 | 0.000 | ||
| 1 spectrum, FETRPPFSQLVLLLER | 0.000 | 0.354 | 0.000 | 0.000 | 0.000 | 0.646 | 0.000 | 0.000 | ||
| 1 spectrum, CMLQNSMGR | 0.000 | 0.193 | 0.000 | 0.000 | 0.000 | 0.807 | 0.000 | 0.000 | ||
| 2 spectra, GFIGTFEDK | 0.000 | 0.286 | 0.000 | 0.000 | 0.000 | 0.714 | 0.000 | 0.000 | ||
| 2 spectra, LQVNVPVR | 0.000 | 0.196 | 0.000 | 0.000 | 0.000 | 0.804 | 0.000 | 0.000 |
| Plot | Mito | Lyso or Perox | ER | Golgi | PM | Cytosol | Nucleus | ||||||
| Expt B |
1 peptide |
2 spectra |
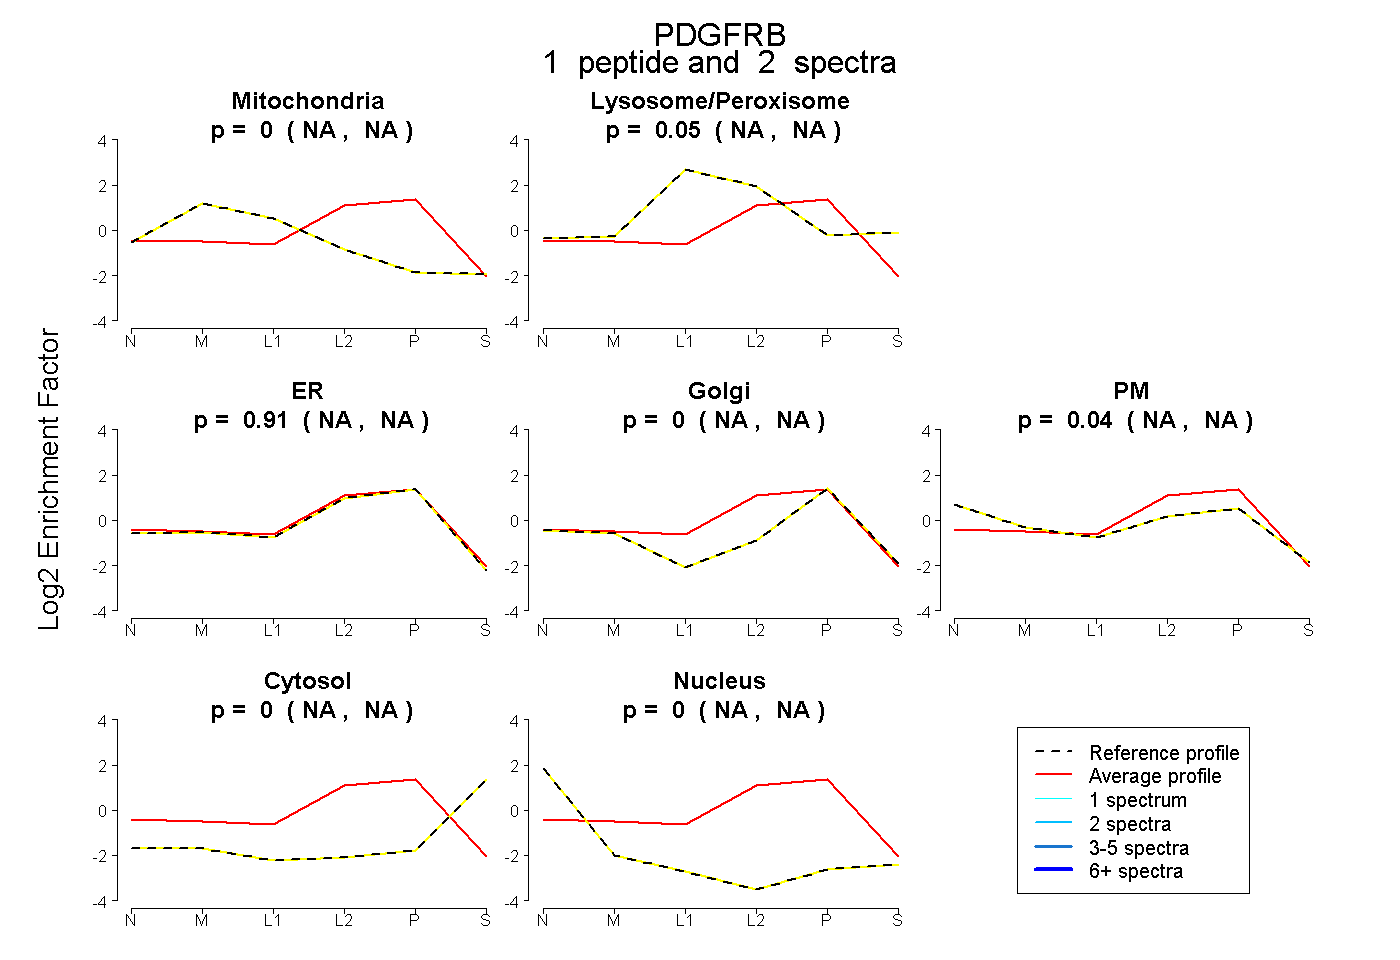 |
0.000 NA | NA |
0.047 NA | NA |
0.914 NA | NA |
0.000 NA | NA |
0.039 NA | NA |
0.000 NA | NA |
0.000 NA | NA |
|||
| Plot | Lyso | Other | |||||||||||
| Expt C |
16 peptides |
42 spectra |
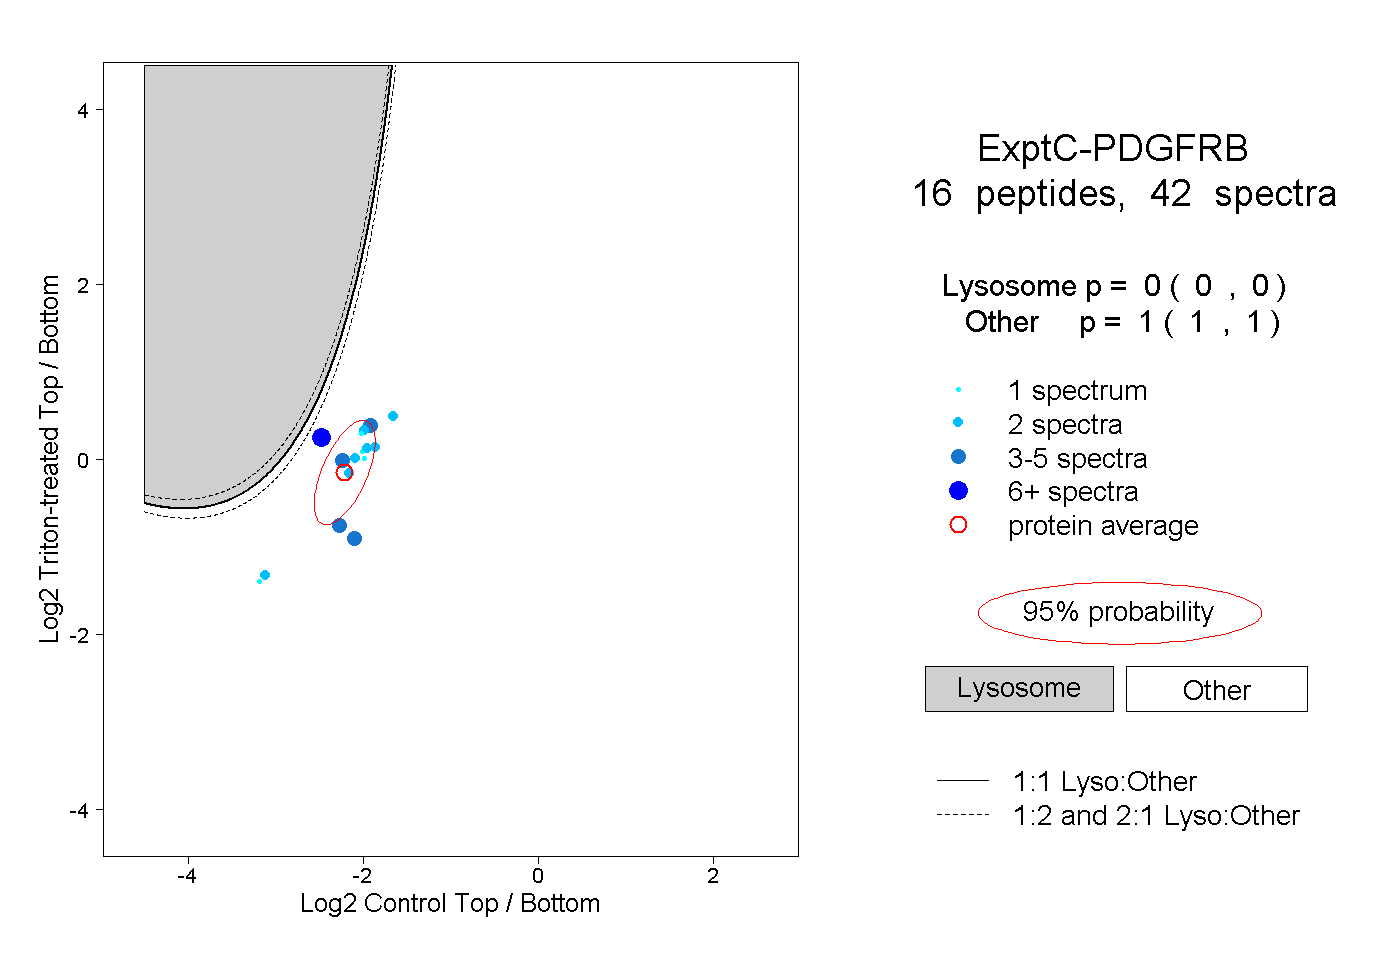 |
0.000 0.000 | 0.000 |
1.000 1.000 | 1.000 |
||||||||
| Plot | Lyso | Other | |||||||||||
| Expt D |
2 peptides |
7 spectra |
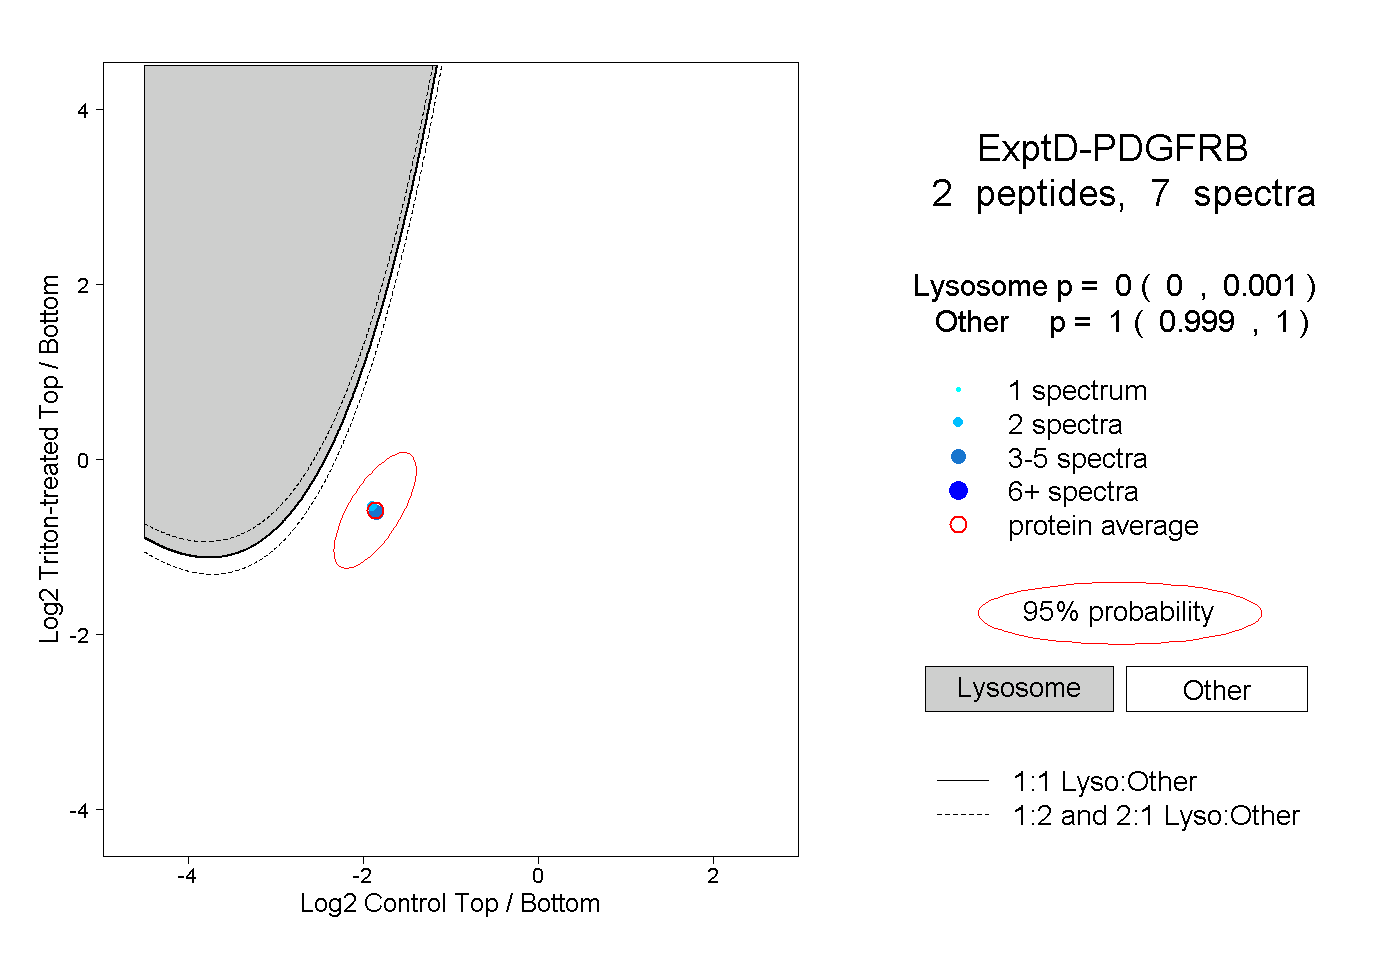 |
0.000 0.000 | 0.001 |
1.000 0.999 | 1.000 |