 10
10peptides
spectra
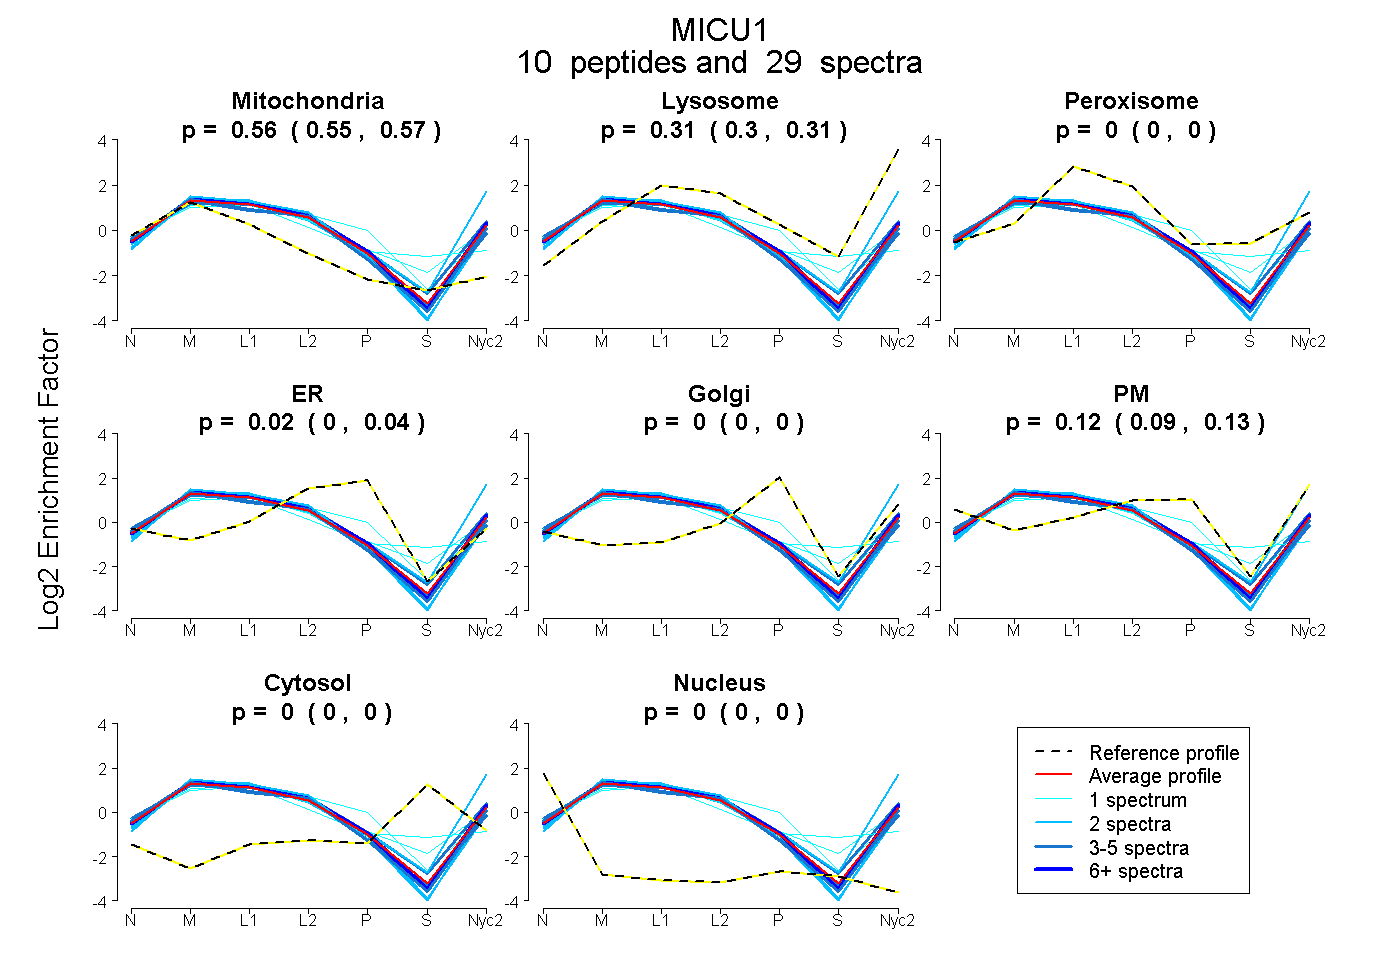
0.553 | 0.565
0.296 | 0.313
0.000 | 0.000
0.001 | 0.035
0.000 | 0.000
0.094 | 0.134
0.000 | 0.000
0.000 | 0.000
3peptides
spectra
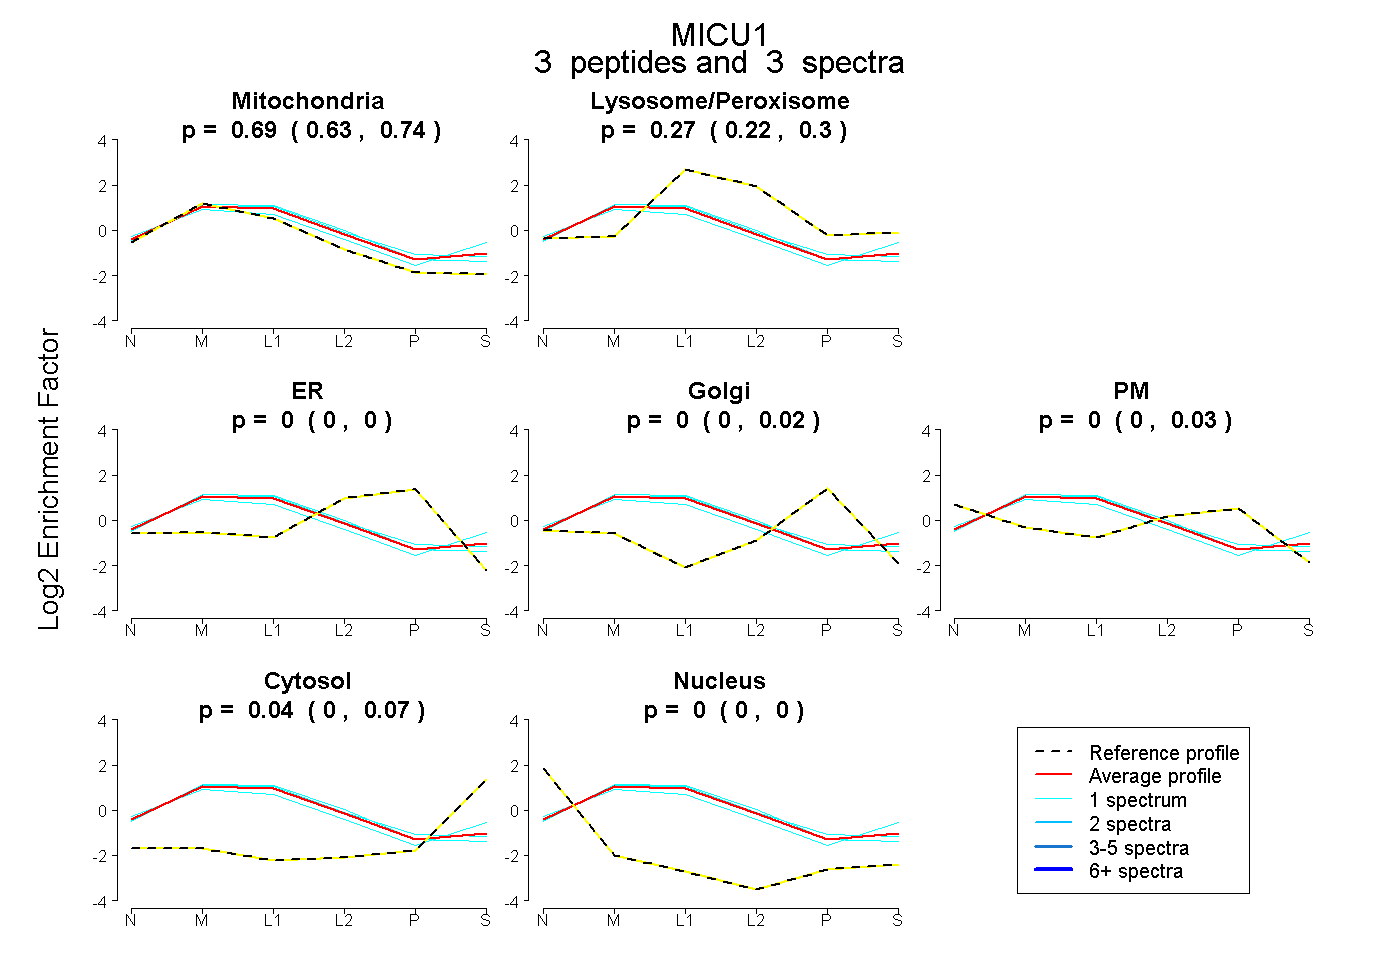
0.634 | 0.739
0.222 | 0.299
0.000 | 0.000
0.000 | 0.024
0.000 | 0.029
0.000 | 0.069
0.000 | 0.000
19peptides
spectra
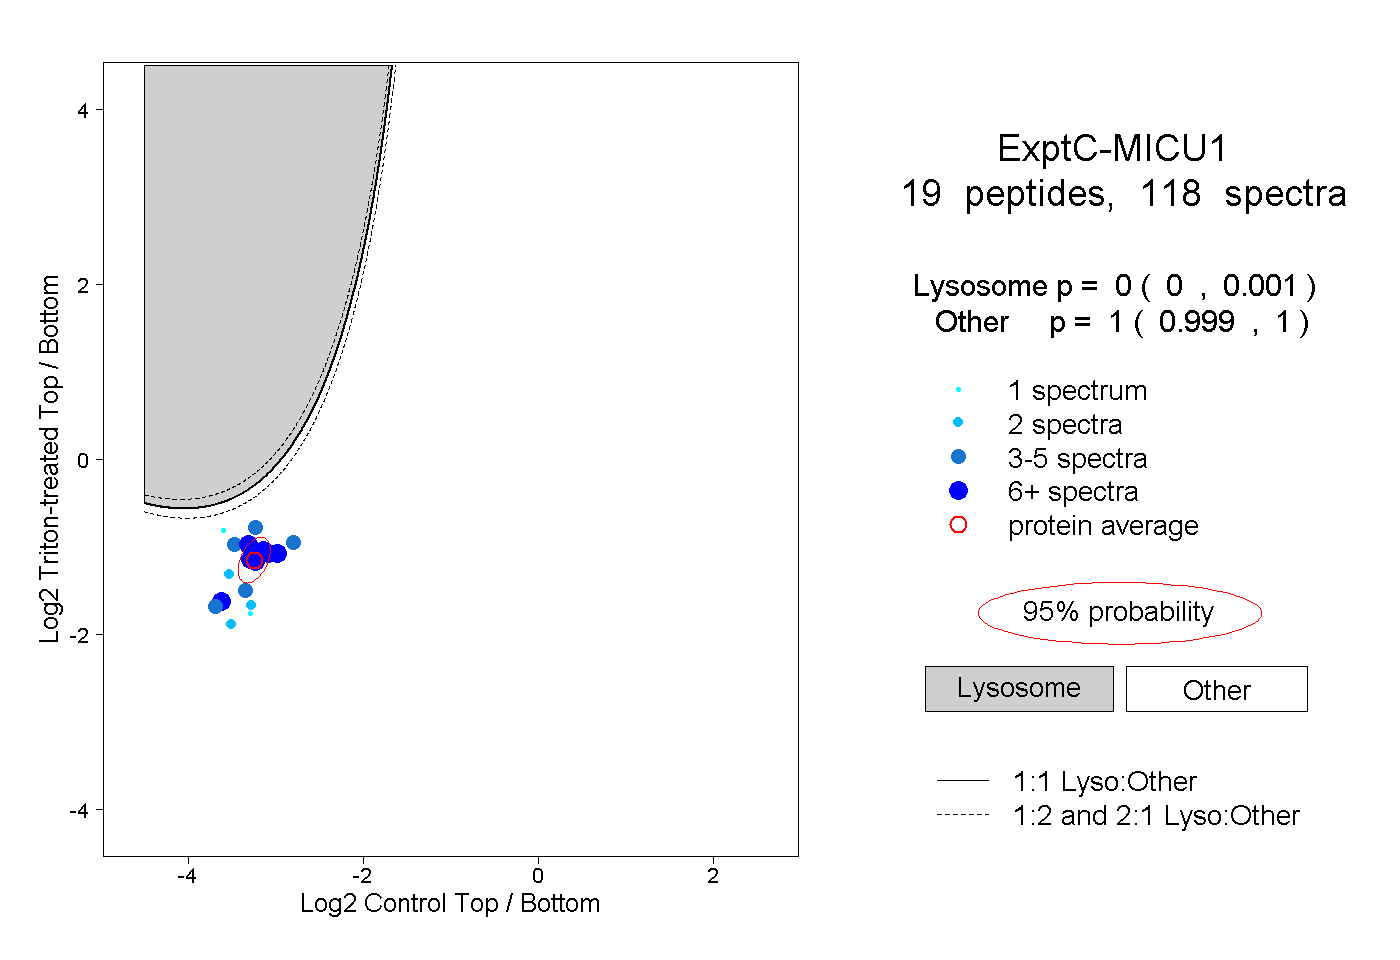
0.000 | 0.001
0.999 | 1.000
6peptides
spectra
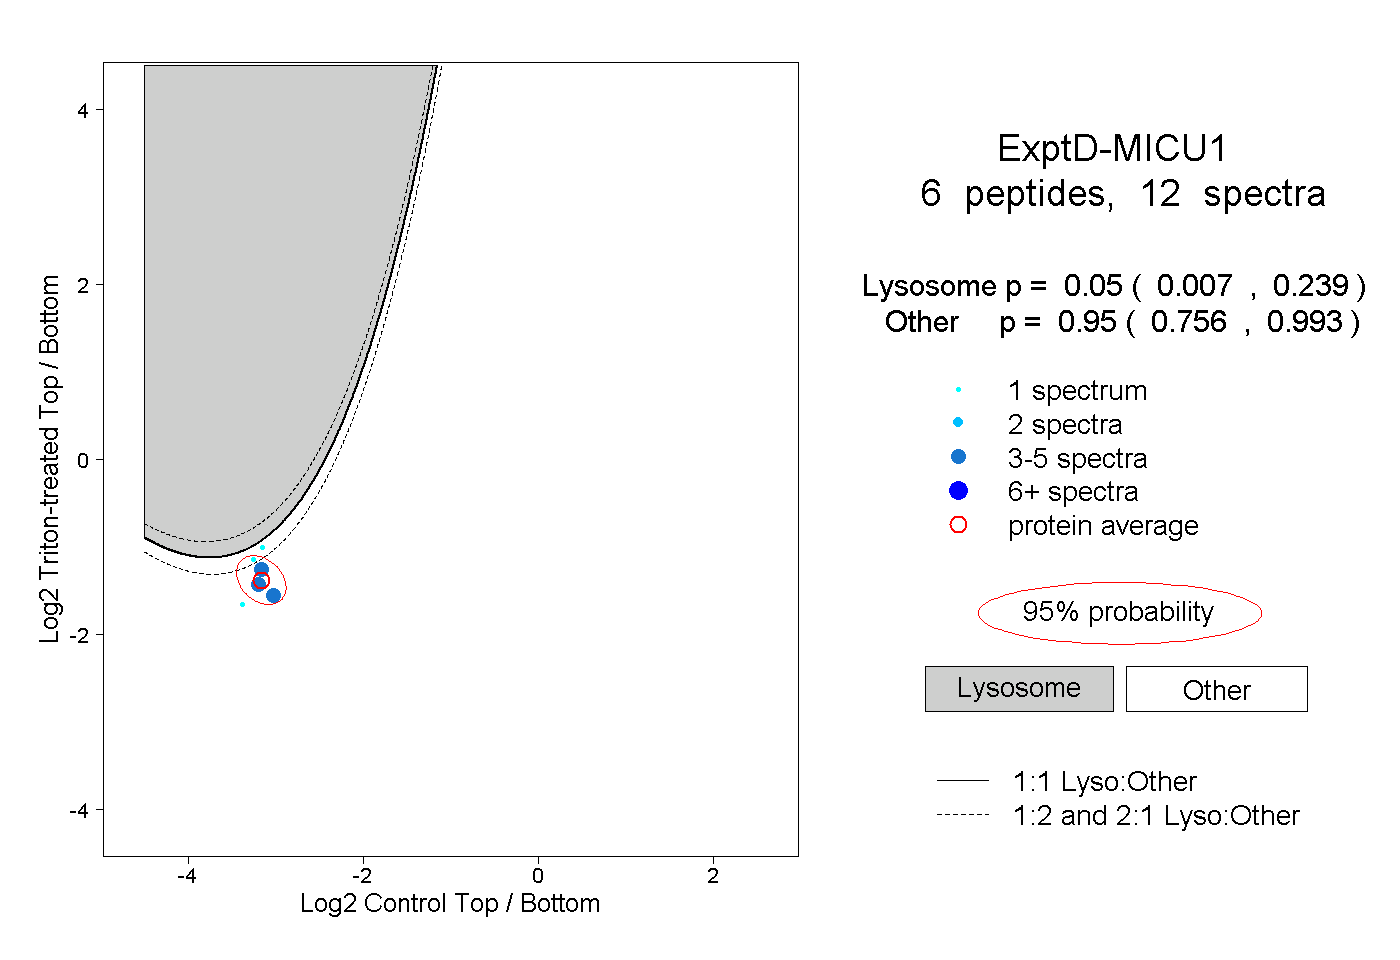
0.007 | 0.239
0.756 | 0.993