 10
10peptides
spectra
0.553 | 0.565
0.296 | 0.313
0.000 | 0.000
0.001 | 0.035
0.000 | 0.000
0.094 | 0.134
0.000 | 0.000
0.000 | 0.000
| Plot | Mito | Lyso | Perox | ER | Golgi | PM | Cytosol | Nucleus | |||||
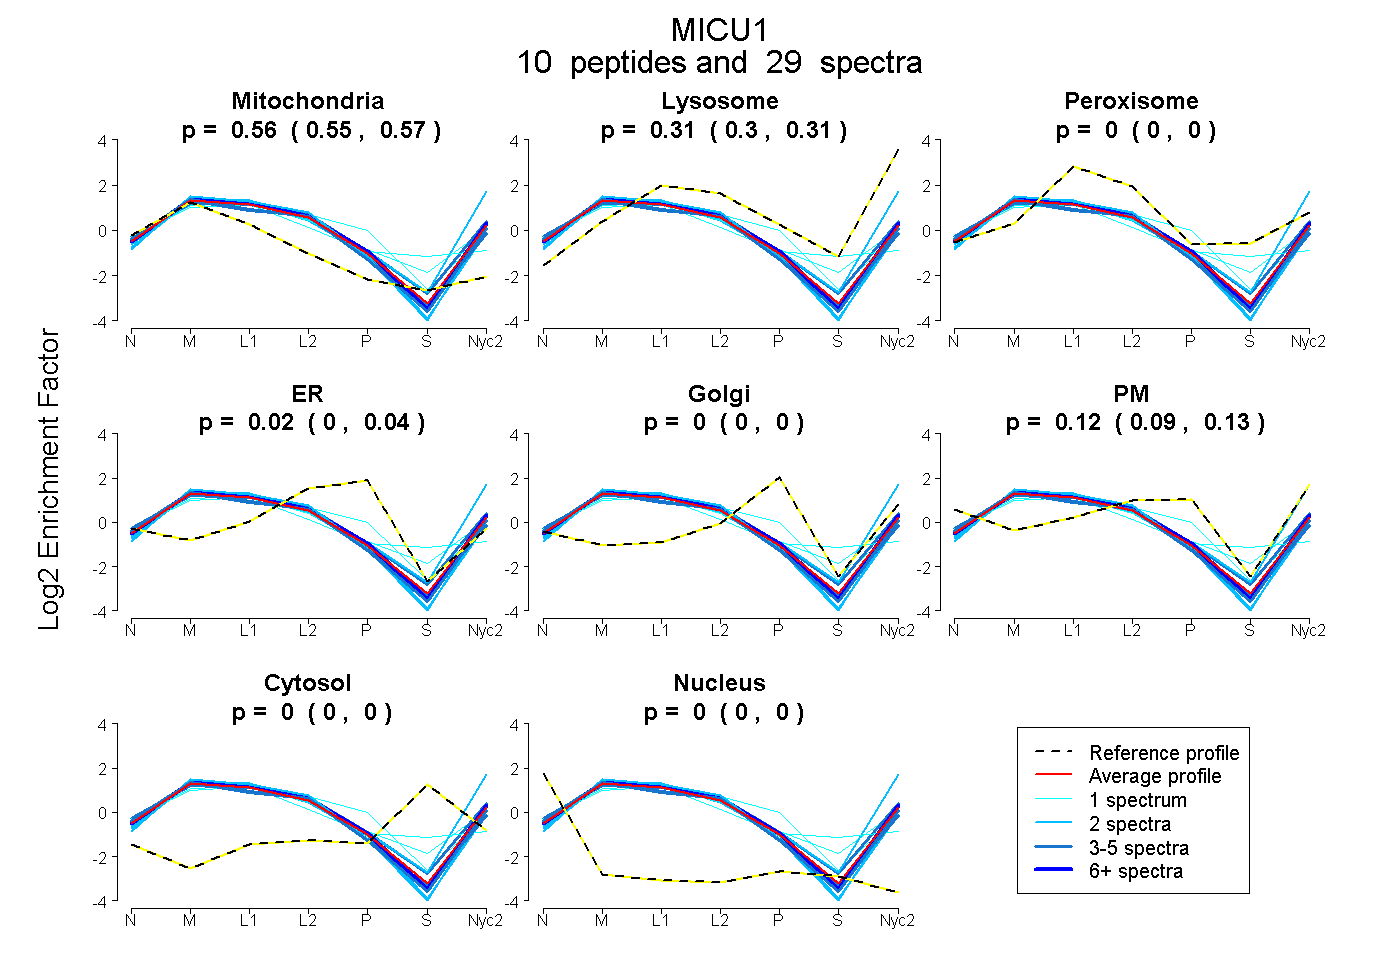
| Expt A |
10 peptides |
29 spectra |
|
0.559 0.553 | 0.565 |
0.305 0.296 | 0.313 |
0.000 0.000 | 0.000 |
0.019 0.001 | 0.035 |
0.000 0.000 | 0.000 |
0.116 0.094 | 0.134 |
0.000 0.000 | 0.000 |
0.000 0.000 | 0.000 |
| 1 spectrum, NFEIAFK | 0.492 | 0.000 | 0.419 | 0.000 | 0.041 | 0.000 | 0.049 | 0.000 | ||
| 7 spectra, SQTSMGMR | 0.540 | 0.304 | 0.000 | 0.021 | 0.000 | 0.135 | 0.000 | 0.000 | ||
| 5 spectra, VTMQQVAR | 0.596 | 0.245 | 0.000 | 0.000 | 0.000 | 0.159 | 0.000 | 0.000 | ||
| 2 spectra, VINEPGETEVFMTPQDFVR | 0.584 | 0.346 | 0.000 | 0.070 | 0.000 | 0.000 | 0.000 | 0.000 | ||
| 2 spectra, DMGFTR | 0.608 | 0.269 | 0.000 | 0.084 | 0.000 | 0.040 | 0.000 | 0.000 | ||
| 2 spectra, LMQAMWK | 0.404 | 0.563 | 0.000 | 0.000 | 0.000 | 0.033 | 0.000 | 0.000 | ||
| 1 spectrum, EFVSIMK | 0.396 | 0.169 | 0.116 | 0.280 | 0.000 | 0.039 | 0.000 | 0.000 | ||
| 4 spectra, HDPVDGR | 0.491 | 0.277 | 0.058 | 0.000 | 0.000 | 0.174 | 0.000 | 0.000 | ||
| 1 spectrum, GLTFQEVENFFTFLK | 0.499 | 0.255 | 0.190 | 0.021 | 0.000 | 0.035 | 0.000 | 0.000 | ||
| 4 spectra, NFLEFQR | 0.605 | 0.234 | 0.000 | 0.039 | 0.000 | 0.122 | 0.000 | 0.000 |
| Plot | Mito | Lyso or Perox | ER | Golgi | PM | Cytosol | Nucleus | ||||||
| Expt B |
3 peptides |
3 spectra |
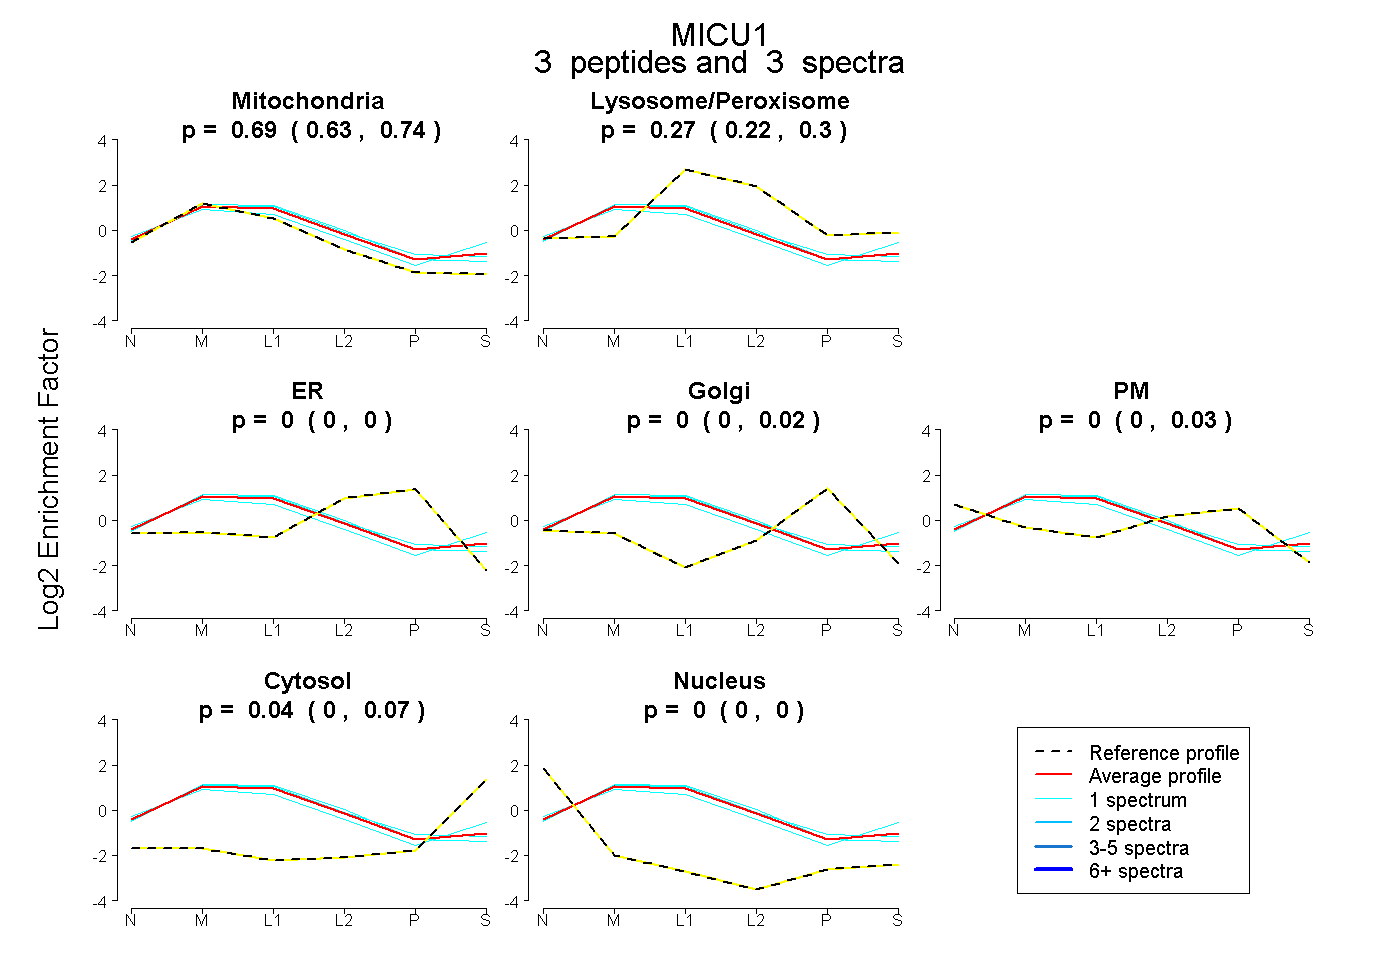 |
0.692 0.634 | 0.739 |
0.269 0.222 | 0.299 |
0.000 0.000 | 0.000 |
0.000 0.000 | 0.024 |
0.000 0.000 | 0.029 |
0.039 0.000 | 0.069 |
0.000 0.000 | 0.000 |
|||
| Plot | Lyso | Other | |||||||||||
| Expt C |
19 peptides |
118 spectra |
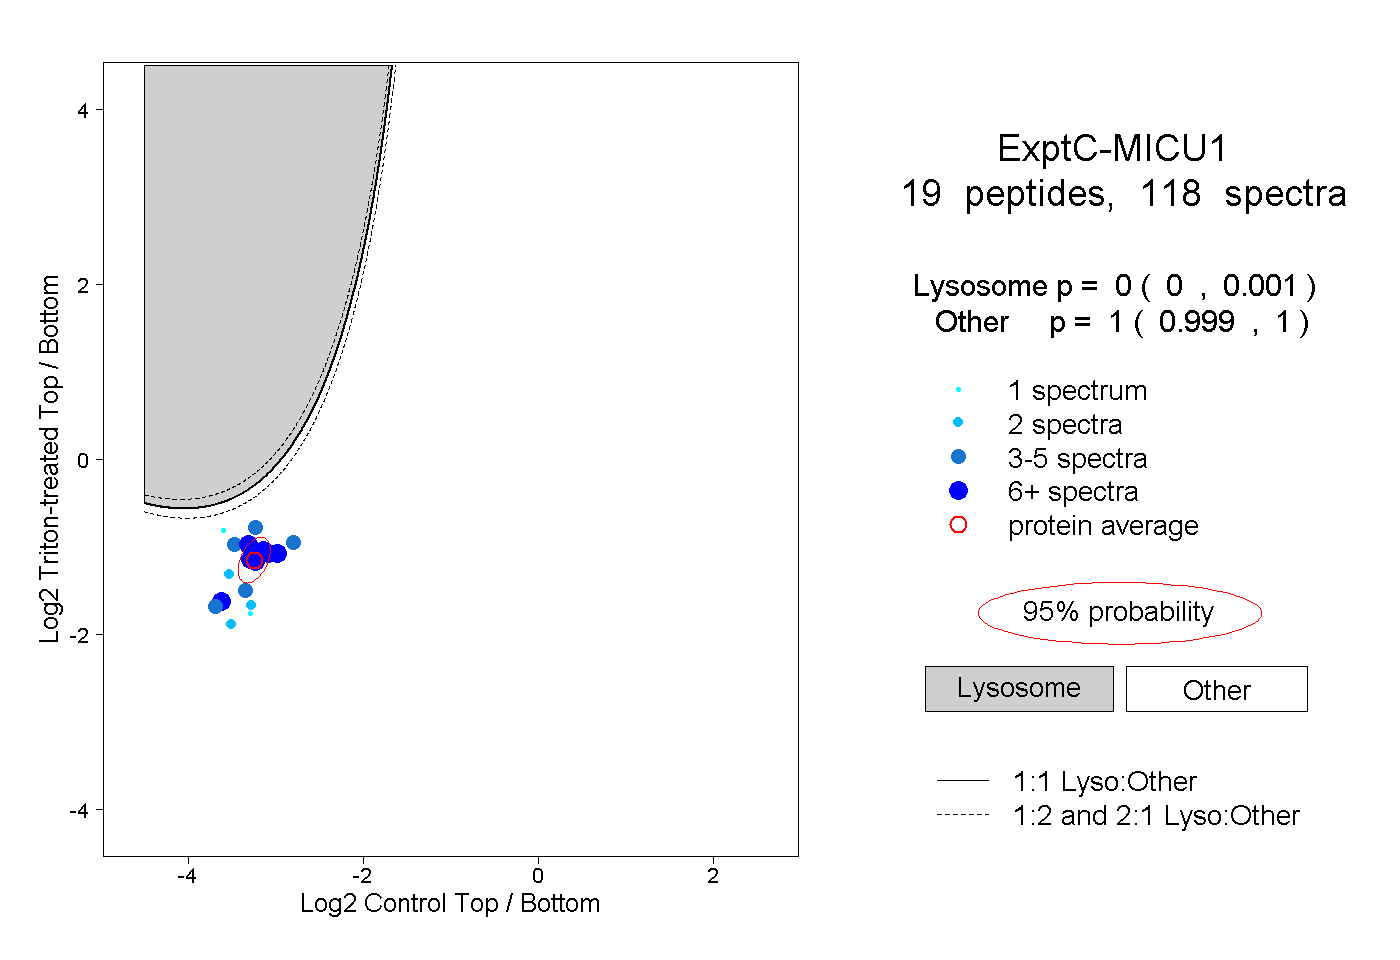 |
0.000 0.000 | 0.001 |
1.000 0.999 | 1.000 |
||||||||
| Plot | Lyso | Other | |||||||||||
| Expt D |
6 peptides |
12 spectra |
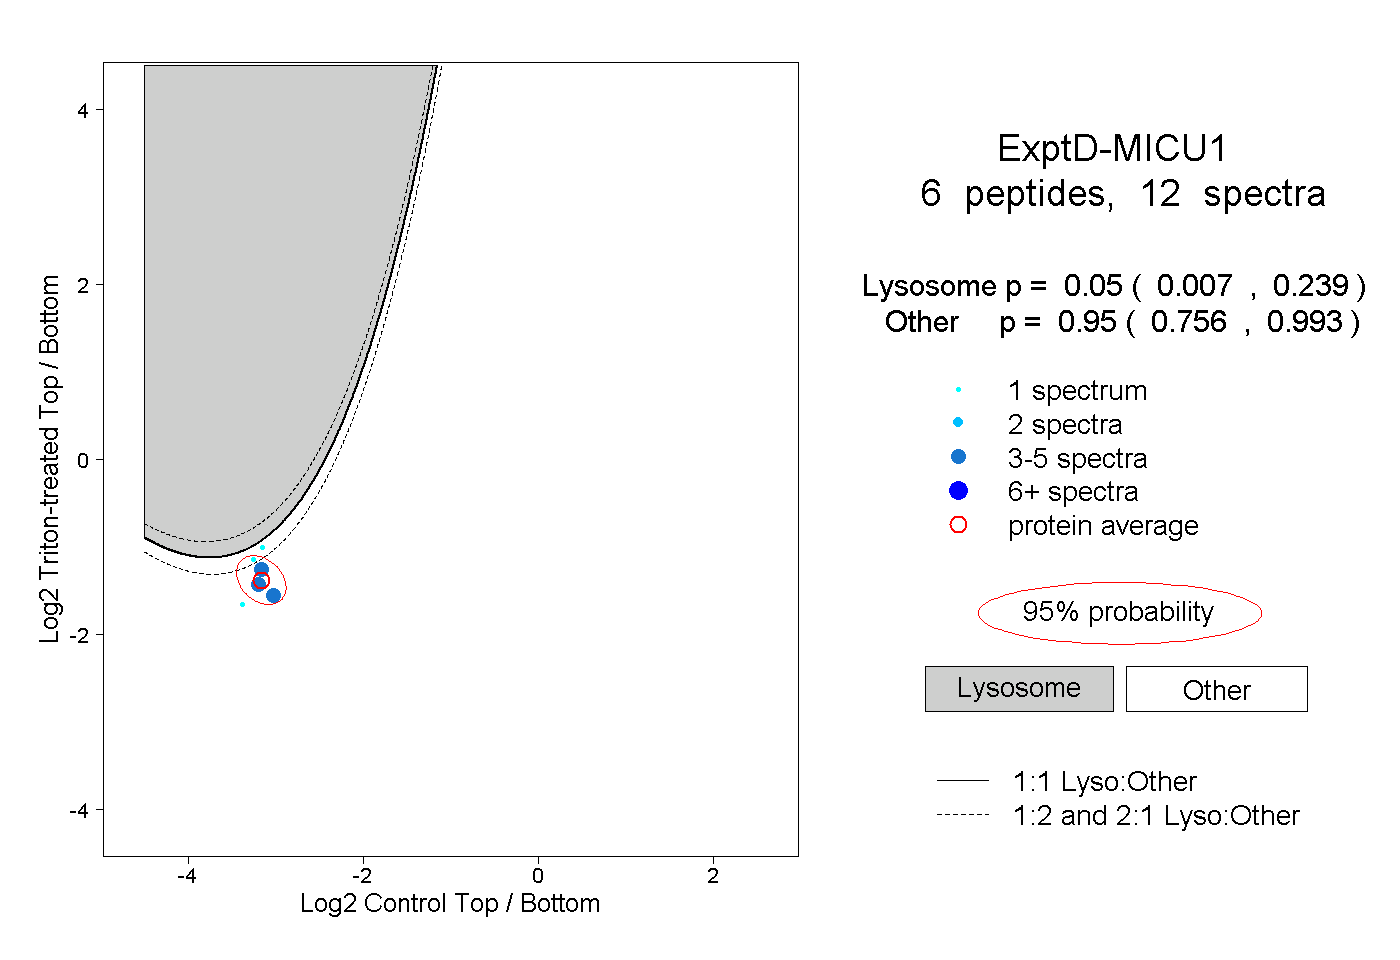 |
0.050 0.007 | 0.239 |
0.950 0.756 | 0.993 |