 10
10peptides
spectra
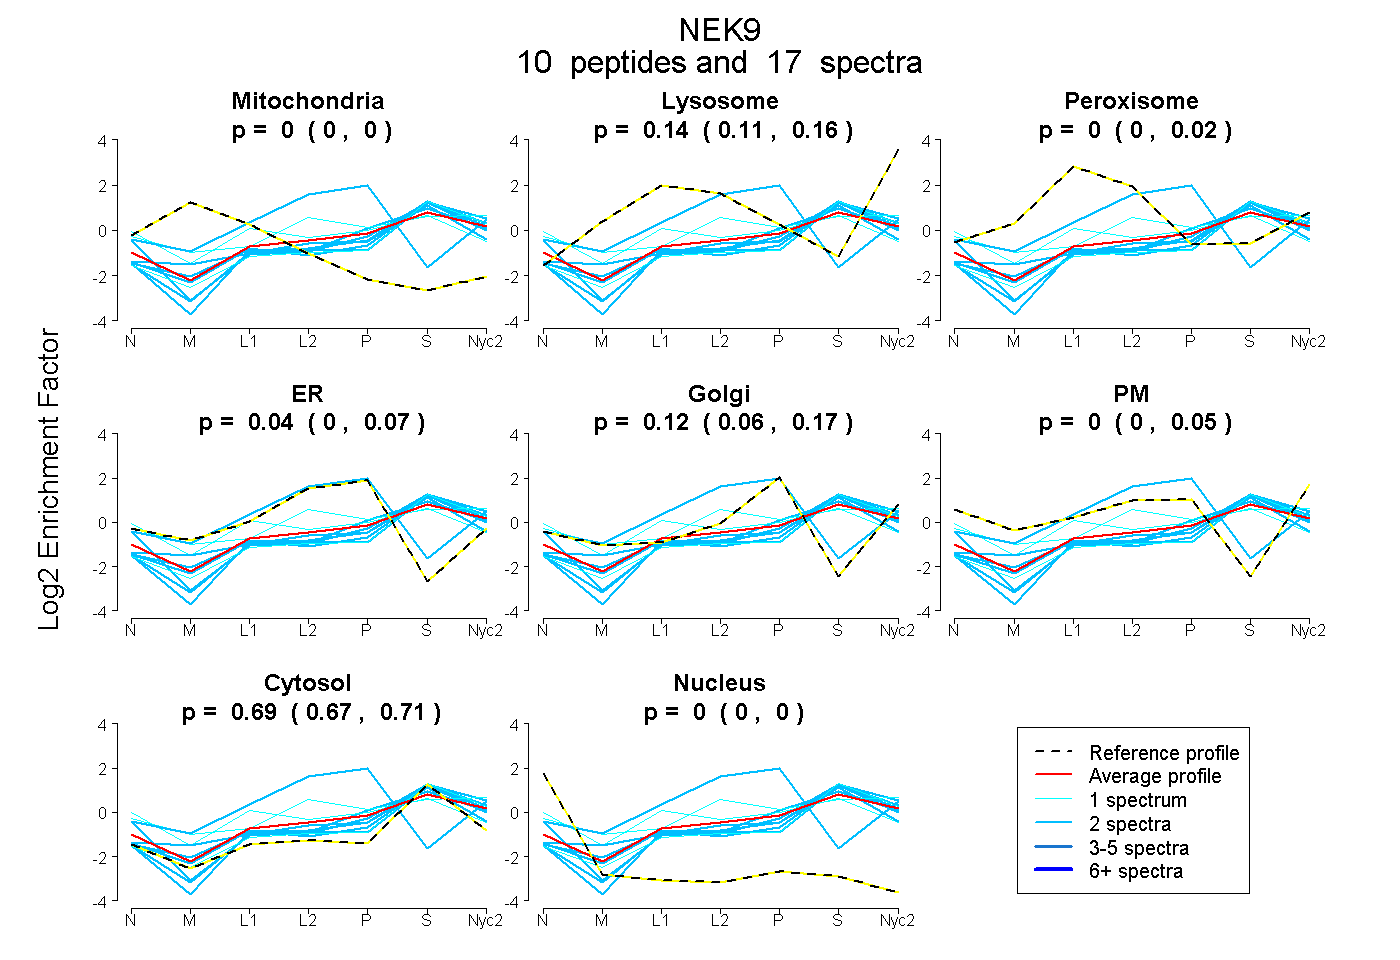
0.000 | 0.000
0.112 | 0.155
0.000 | 0.025
0.000 | 0.074
0.061 | 0.173
0.000 | 0.055
0.670 | 0.711
0.000 | 0.000
2peptides
spectra
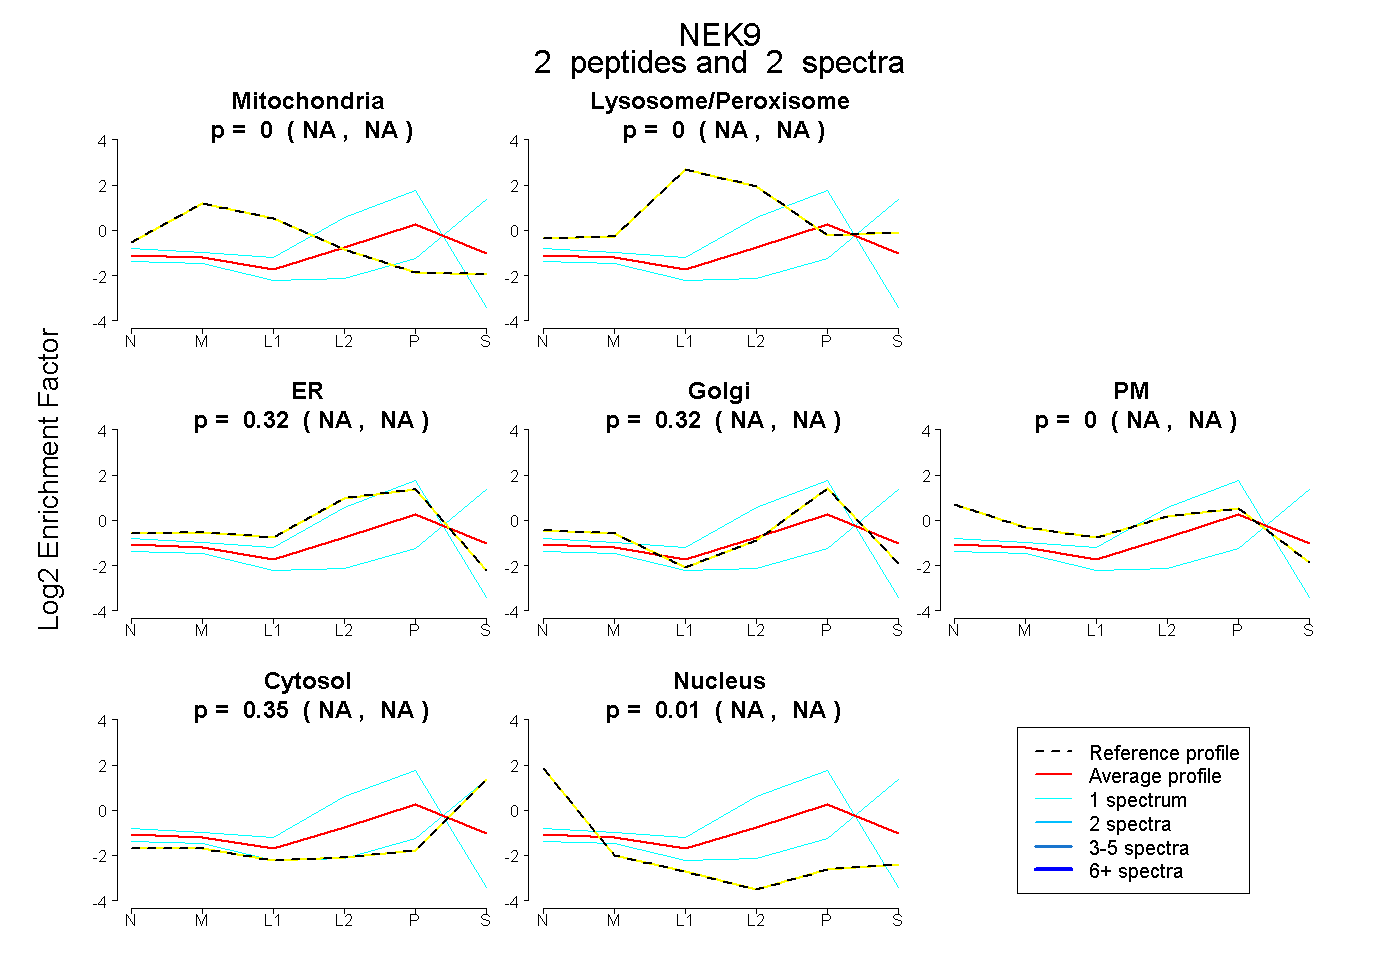
NA | NA
NA | NA
NA | NA
NA | NA
NA | NA
NA | NA
NA | NA
10peptides
spectra
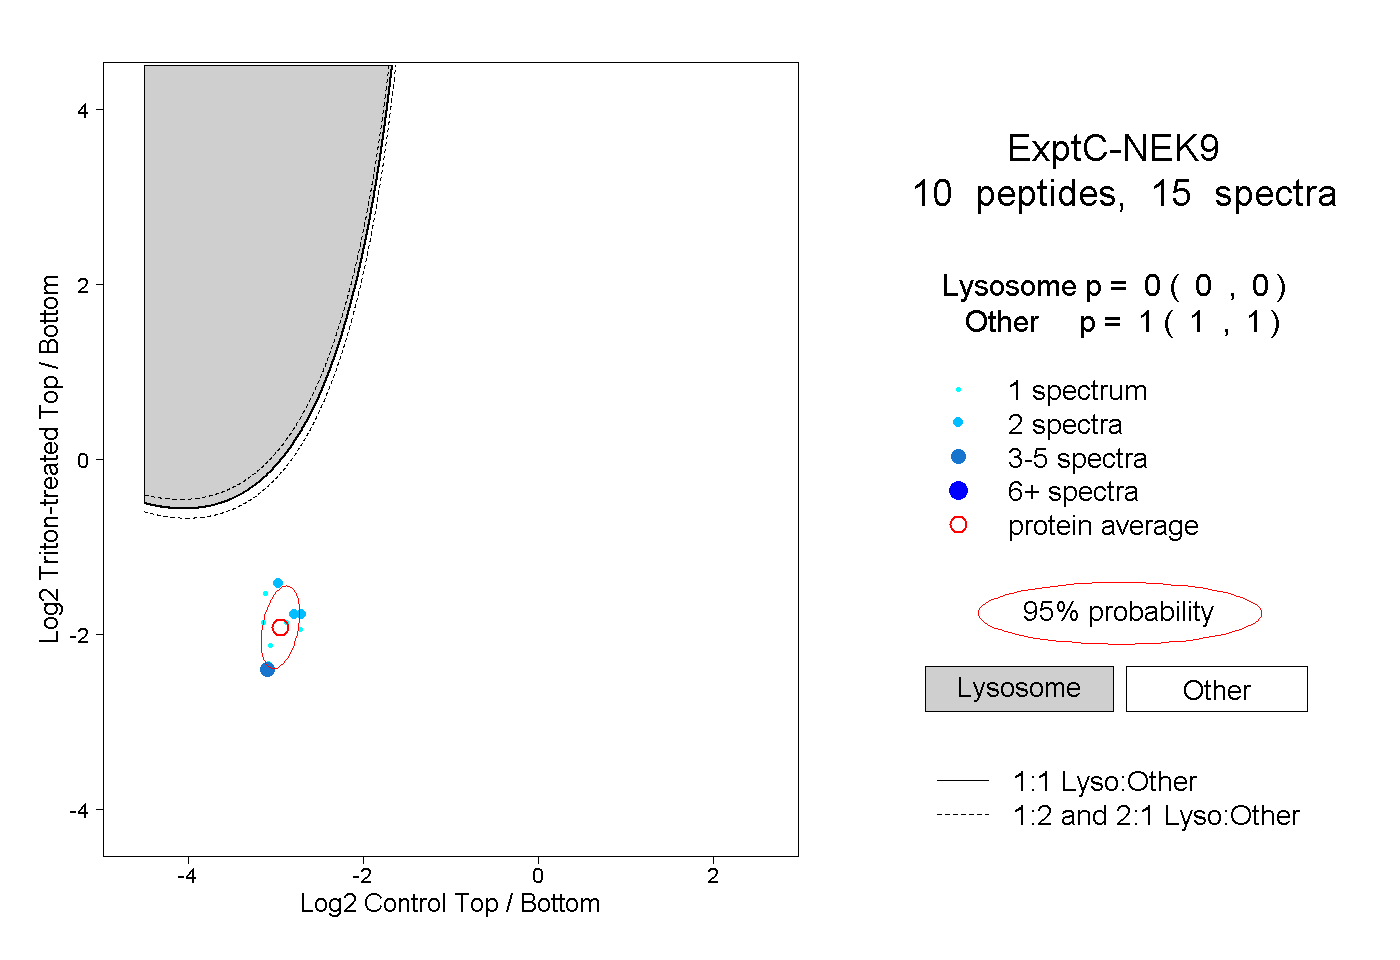
0.000 | 0.000
1.000 | 1.000
1peptide
spectra
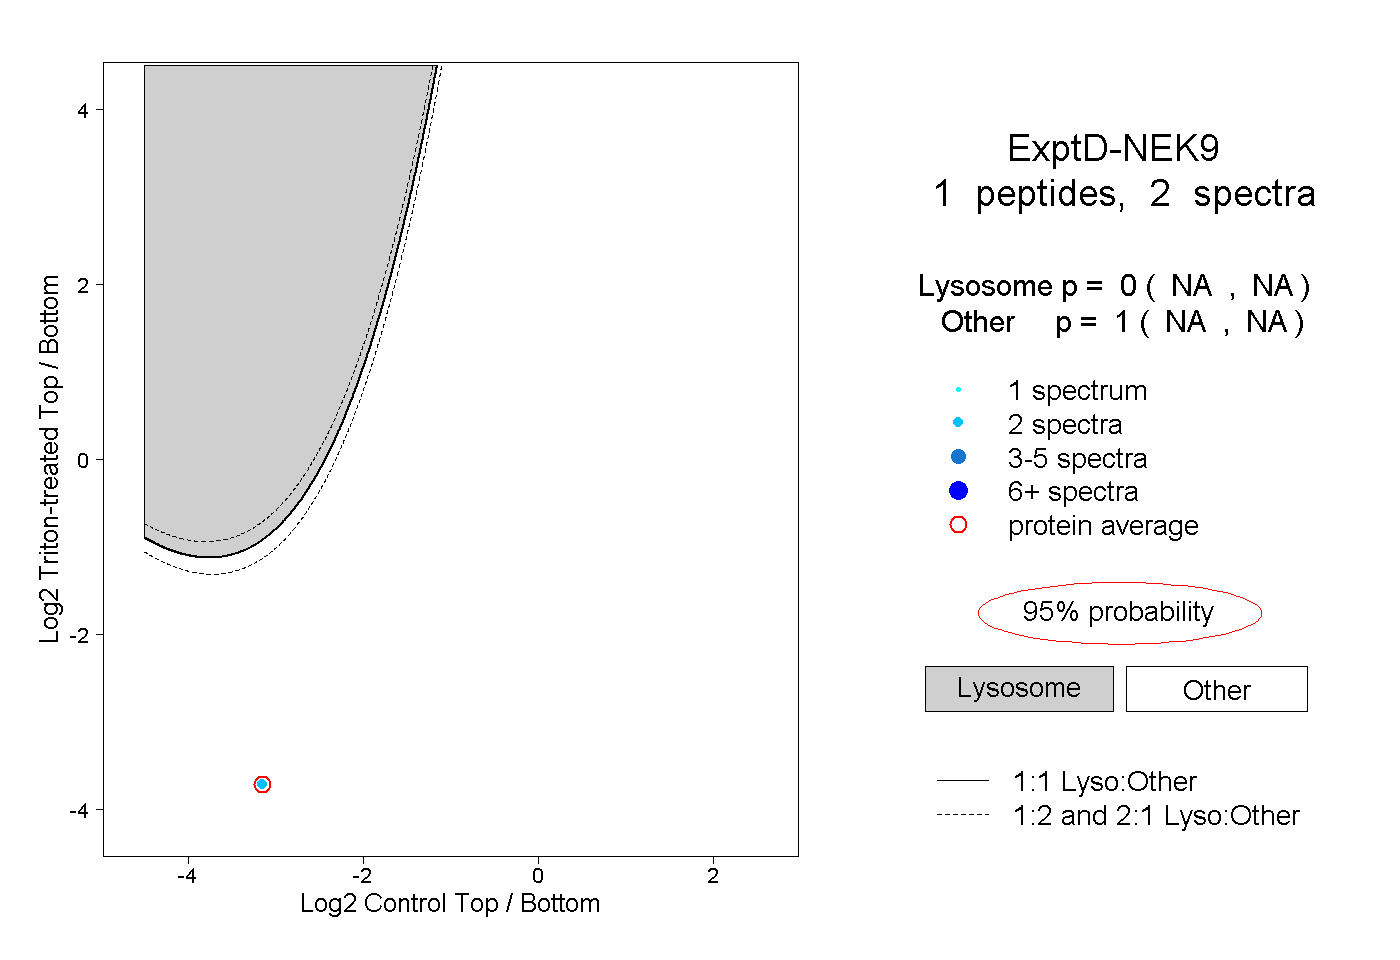
NA | NA
NA | NA