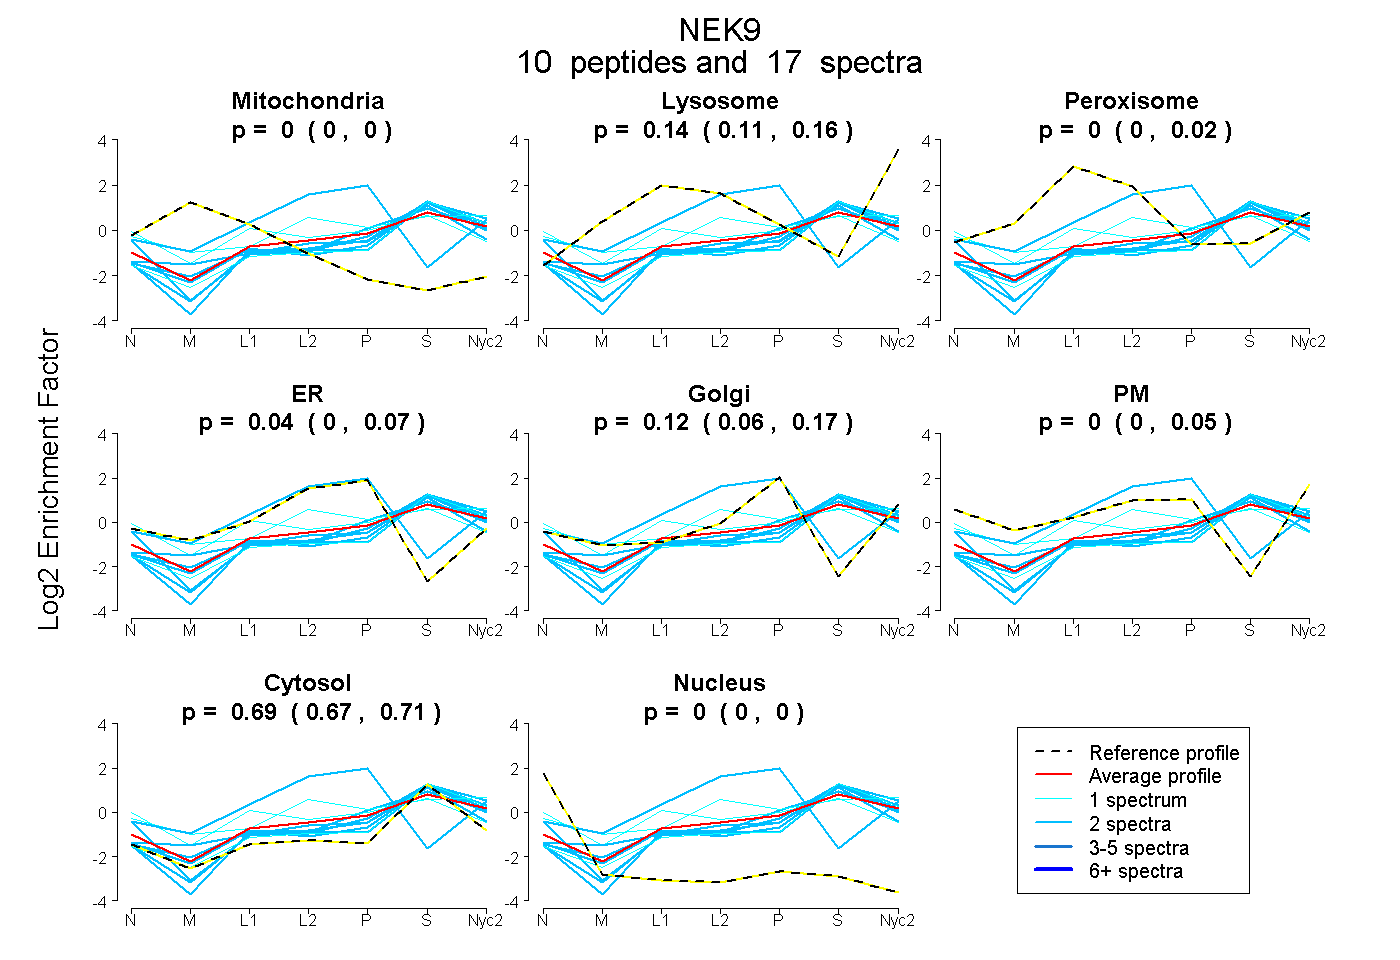
 10
10peptides
spectra
0.000 | 0.000
0.112 | 0.155
0.000 | 0.025
0.000 | 0.074
0.061 | 0.173
0.000 | 0.055
0.670 | 0.711
0.000 | 0.000
| Plot | Mito | Lyso | Perox | ER | Golgi | PM | Cytosol | Nucleus | |||||
| Expt A |
10 peptides |
17 spectra |
|
0.000 0.000 | 0.000 |
0.144 0.112 | 0.155 |
0.000 0.000 | 0.025 |
0.039 0.000 | 0.074 |
0.122 0.061 | 0.173 |
0.001 0.000 | 0.055 |
0.694 0.670 | 0.711 |
0.000 0.000 | 0.000 |
| 2 spectra, LLTFGCNK | 0.000 | 0.096 | 0.036 | 0.074 | 0.017 | 0.000 | 0.776 | 0.000 | ||
| 2 spectra, AGILHR | 0.000 | 0.159 | 0.000 | 0.000 | 0.000 | 0.000 | 0.841 | 0.000 | ||
| 2 spectra, LGINLLGGPLGGK | 0.000 | 0.115 | 0.000 | 0.000 | 0.063 | 0.000 | 0.823 | 0.000 | ||
| 1 spectrum, SSTVTEAPIAVVTSR | 0.000 | 0.136 | 0.000 | 0.000 | 0.000 | 0.000 | 0.864 | 0.000 | ||
| 2 spectra, EVDLTR | 0.000 | 0.154 | 0.000 | 0.000 | 0.008 | 0.000 | 0.838 | 0.000 | ||
| 1 spectrum, LGLDSEEDYYTPQR | 0.000 | 0.000 | 0.223 | 0.109 | 0.000 | 0.098 | 0.556 | 0.014 | ||
| 1 spectrum, THTAAIDER | 0.000 | 0.093 | 0.070 | 0.000 | 0.000 | 0.342 | 0.495 | 0.000 | ||
| 2 spectra, TIAPGK | 0.000 | 0.174 | 0.000 | 0.762 | 0.012 | 0.000 | 0.052 | 0.000 | ||
| 2 spectra, AGGAAEQEELHYIPIR | 0.000 | 0.091 | 0.000 | 0.000 | 0.037 | 0.000 | 0.872 | 0.000 | ||
| 2 spectra, GAFGEATLYR | 0.000 | 0.000 | 0.000 | 0.000 | 0.205 | 0.048 | 0.747 | 0.000 |
| Plot | Mito | Lyso or Perox | ER | Golgi | PM | Cytosol | Nucleus | ||||||
| Expt B |
2 peptides |
2 spectra |
 |
0.000 NA | NA |
0.000 NA | NA |
0.315 NA | NA |
0.324 NA | NA |
0.000 NA | NA |
0.347 NA | NA |
0.013 NA | NA |
|||
| Plot | Lyso | Other | |||||||||||
| Expt C |
10 peptides |
15 spectra |
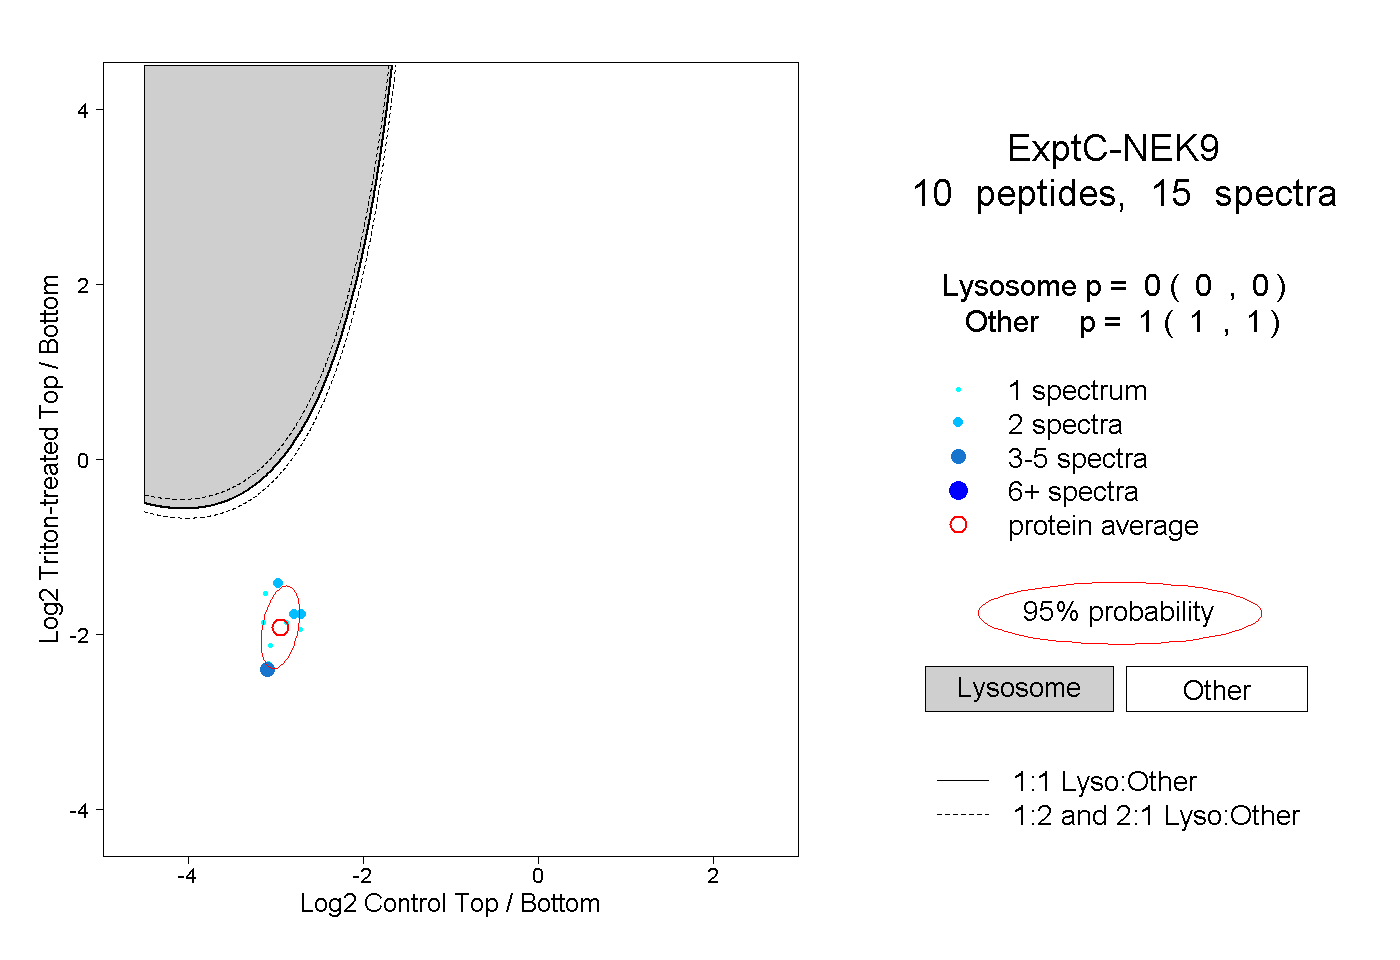 |
0.000 0.000 | 0.000 |
1.000 1.000 | 1.000 |
||||||||
| Plot | Lyso | Other | |||||||||||
| Expt D |
1 peptide |
2 spectra |
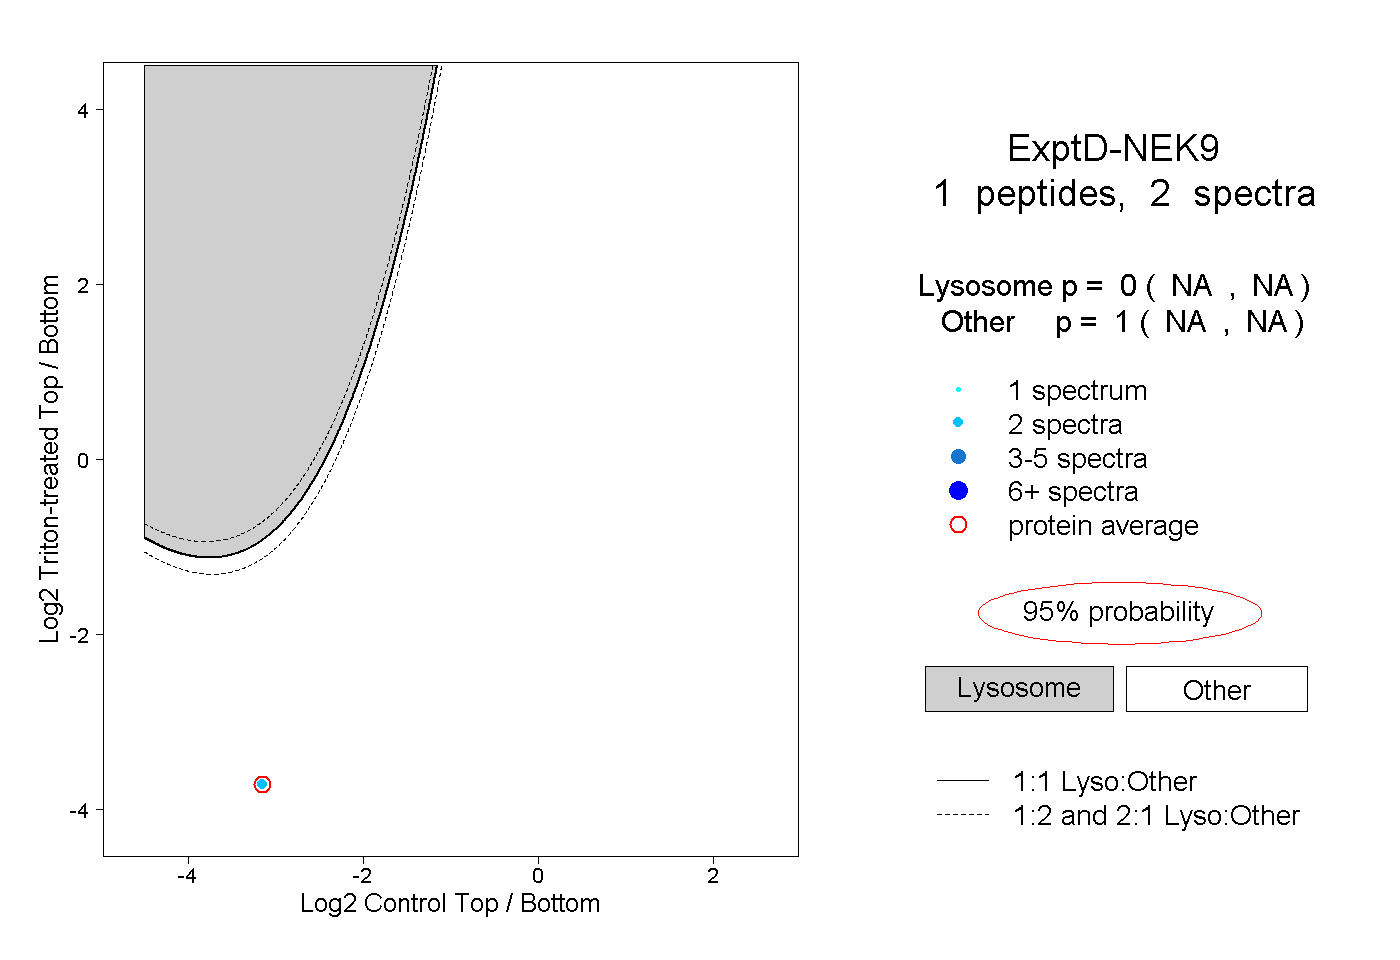 |
0.000 NA | NA |
1.000 NA | NA |