 11
11peptides
spectra
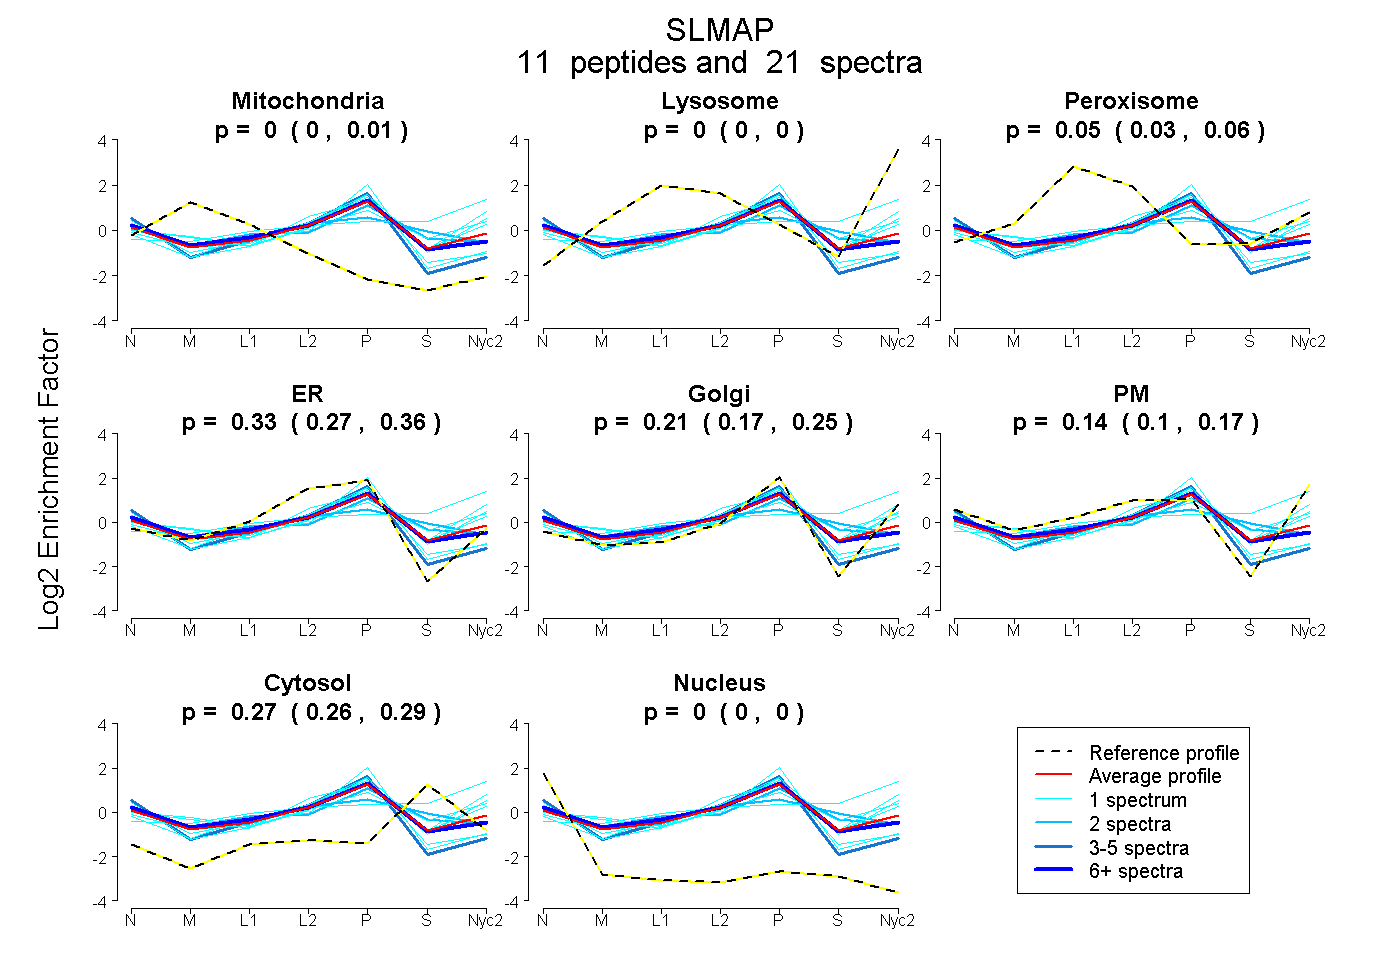
0.000 | 0.010
0.000 | 0.000
0.029 | 0.061
0.274 | 0.363
0.171 | 0.255
0.100 | 0.174
0.258 | 0.285
0.000 | 0.001
4peptides
spectra
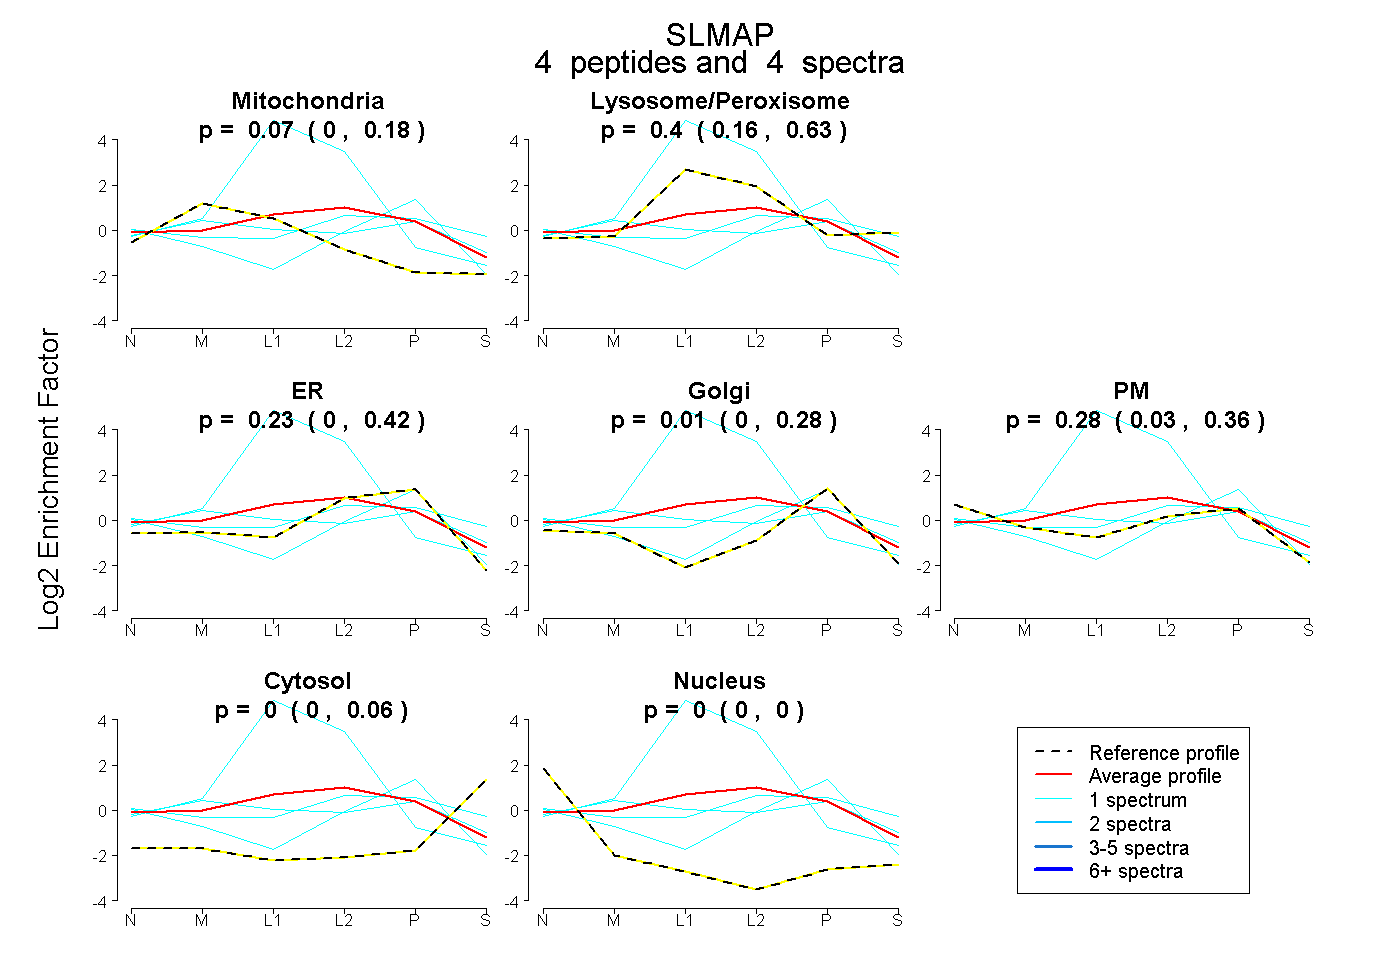
0.000 | 0.180
0.162 | 0.635
0.000 | 0.420
0.000 | 0.283
0.031 | 0.360
0.000 | 0.063
0.000 | 0.000
4peptides
spectra
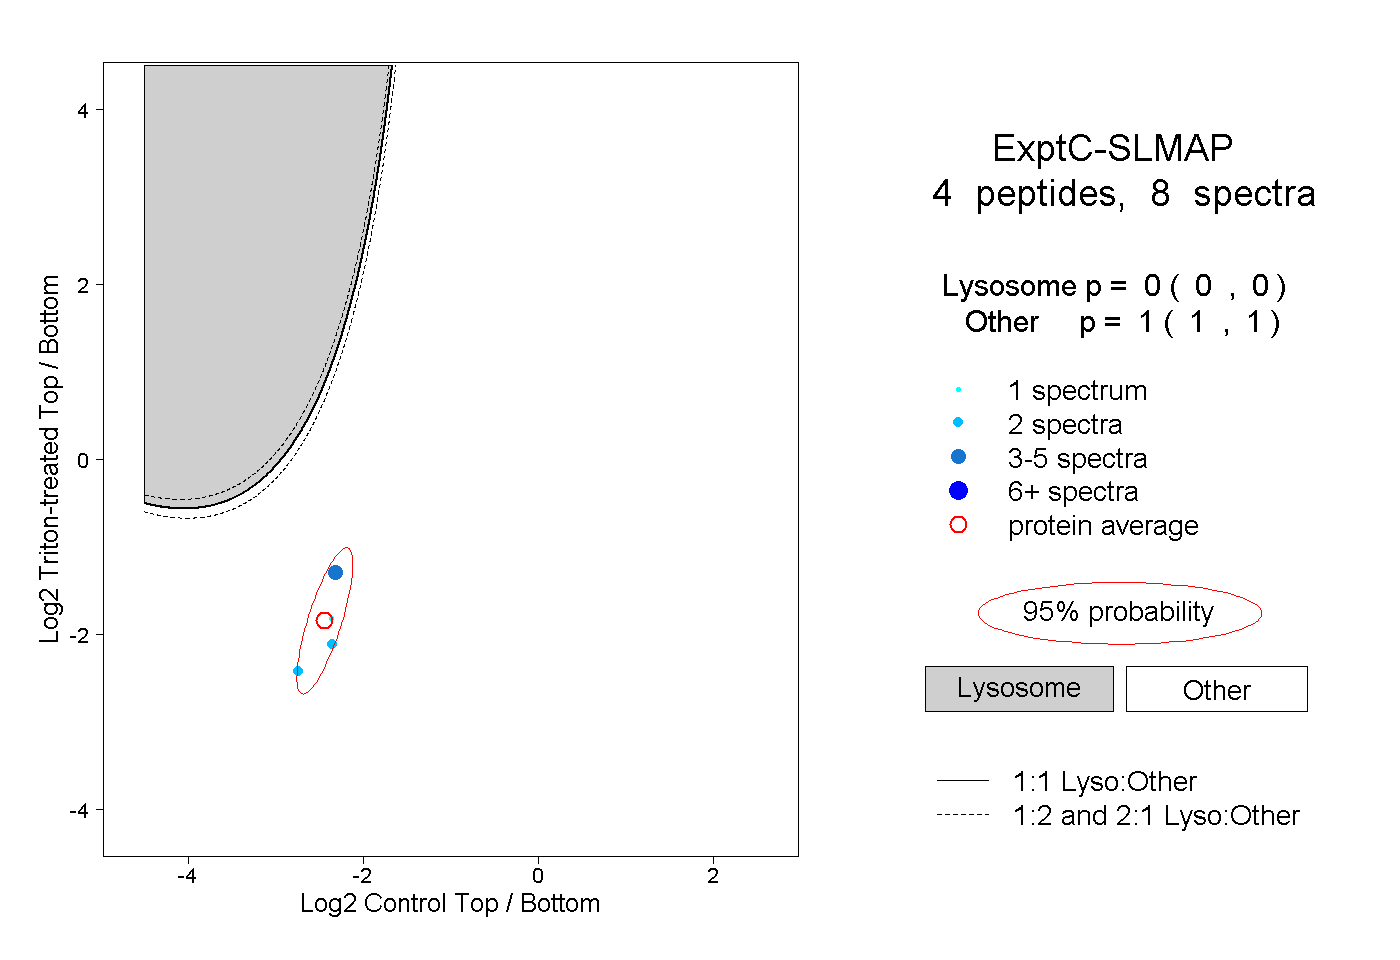
0.000 | 0.000
1.000 | 1.000
6peptides
spectra
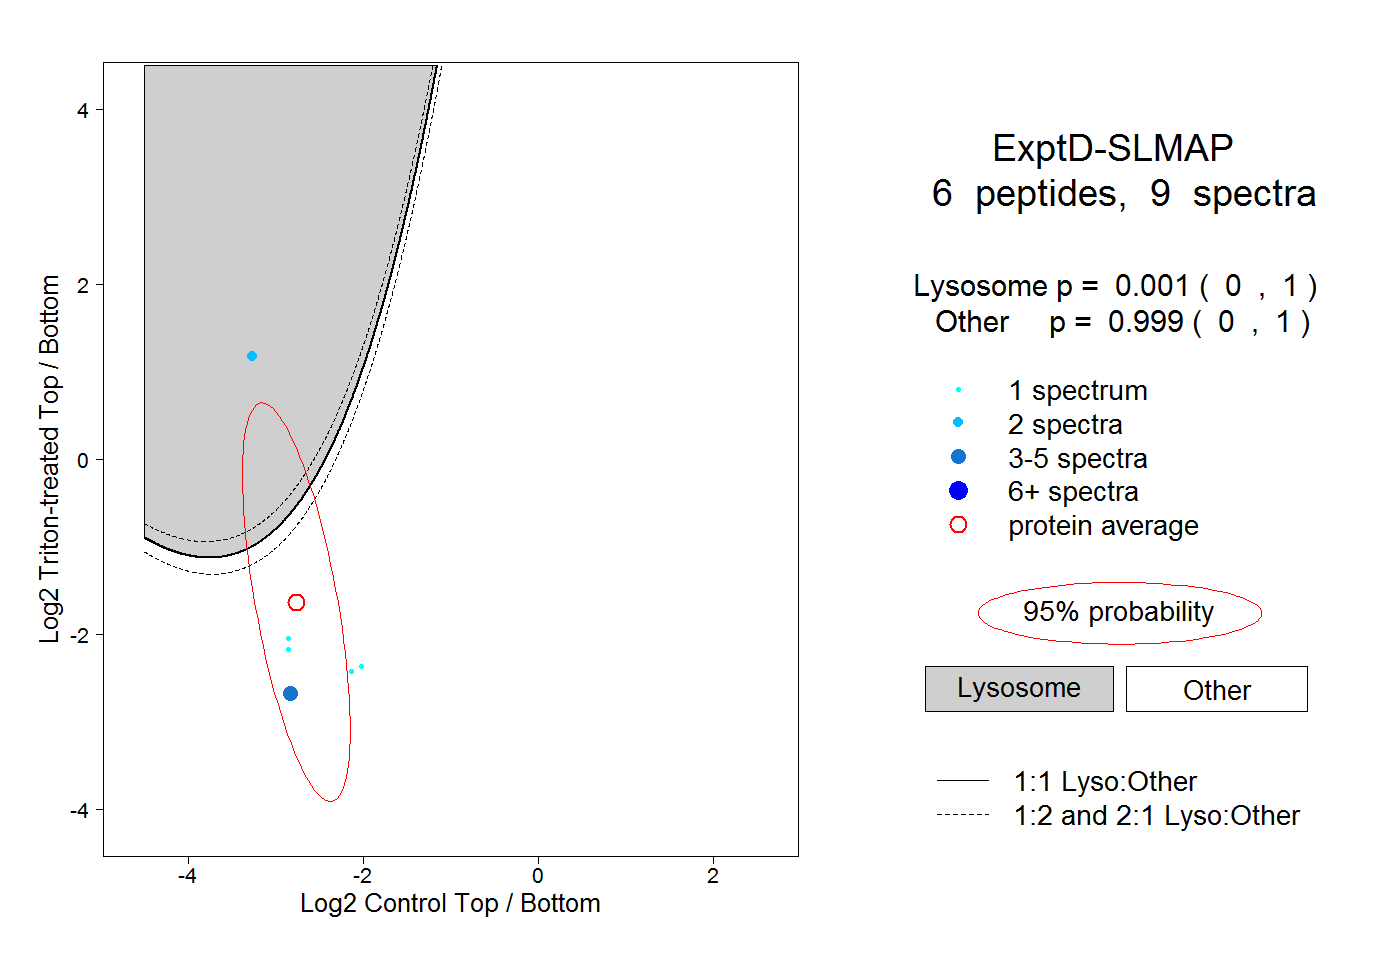
0.000 | 1.000
0.000 | 1.000