 11
11peptides
spectra
0.000 | 0.010
0.000 | 0.000
0.029 | 0.061
0.274 | 0.363
0.171 | 0.255
0.100 | 0.174
0.258 | 0.285
0.000 | 0.001
| Plot | Mito | Lyso | Perox | ER | Golgi | PM | Cytosol | Nucleus | |||||
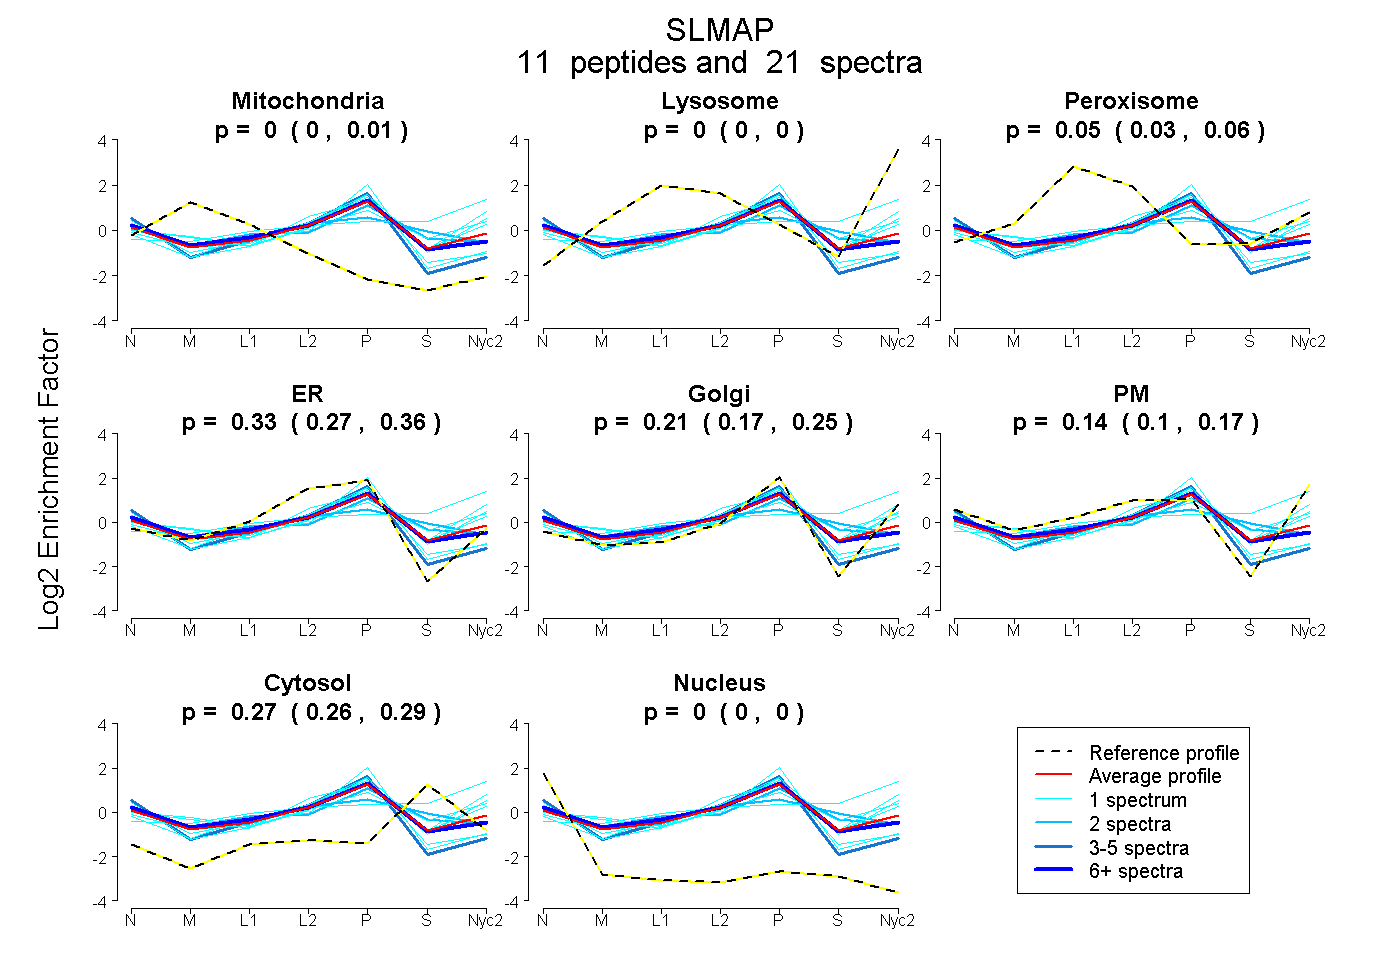
| Expt A |
11 peptides |
21 spectra |
|
0.000 0.000 | 0.010 |
0.000 0.000 | 0.000 |
0.046 0.029 | 0.061 |
0.326 0.274 | 0.363 |
0.213 0.171 | 0.255 |
0.141 0.100 | 0.174 |
0.274 0.258 | 0.285 |
0.000 0.000 | 0.001 |
| 1 spectrum, IEALQADNDFTNER | 0.000 | 0.319 | 0.004 | 0.000 | 0.000 | 0.274 | 0.404 | 0.000 | ||
| 4 spectra, AASEYEEEIR | 0.000 | 0.000 | 0.000 | 0.732 | 0.046 | 0.000 | 0.060 | 0.163 | ||
| 2 spectra, AELEGWR | 0.038 | 0.000 | 0.132 | 0.273 | 0.246 | 0.000 | 0.310 | 0.001 | ||
| 1 spectrum, QIQVLQVQLQR | 0.000 | 0.000 | 0.000 | 0.165 | 0.240 | 0.377 | 0.218 | 0.000 | ||
| 1 spectrum, ELVALQEDK | 0.003 | 0.000 | 0.116 | 0.000 | 0.298 | 0.291 | 0.292 | 0.000 | ||
| 1 spectrum, DDLQGTQAETEAK | 0.000 | 0.043 | 0.025 | 0.082 | 0.287 | 0.367 | 0.197 | 0.000 | ||
| 6 spectra, QSITDELK | 0.002 | 0.000 | 0.112 | 0.391 | 0.246 | 0.000 | 0.214 | 0.037 | ||
| 1 spectrum, NQTEDSLR | 0.000 | 0.000 | 0.091 | 0.183 | 0.457 | 0.072 | 0.197 | 0.000 | ||
| 1 spectrum, ELVEAQELAR | 0.000 | 0.000 | 0.000 | 0.568 | 0.162 | 0.000 | 0.144 | 0.125 | ||
| 2 spectra, ENVLLSSELQR | 0.016 | 0.000 | 0.094 | 0.334 | 0.000 | 0.143 | 0.403 | 0.010 | ||
| 1 spectrum, LFLPDGMEAR | 0.000 | 0.000 | 0.000 | 0.556 | 0.243 | 0.000 | 0.137 | 0.063 |
| Plot | Mito | Lyso or Perox | ER | Golgi | PM | Cytosol | Nucleus | ||||||
| Expt B |
4 peptides |
4 spectra |
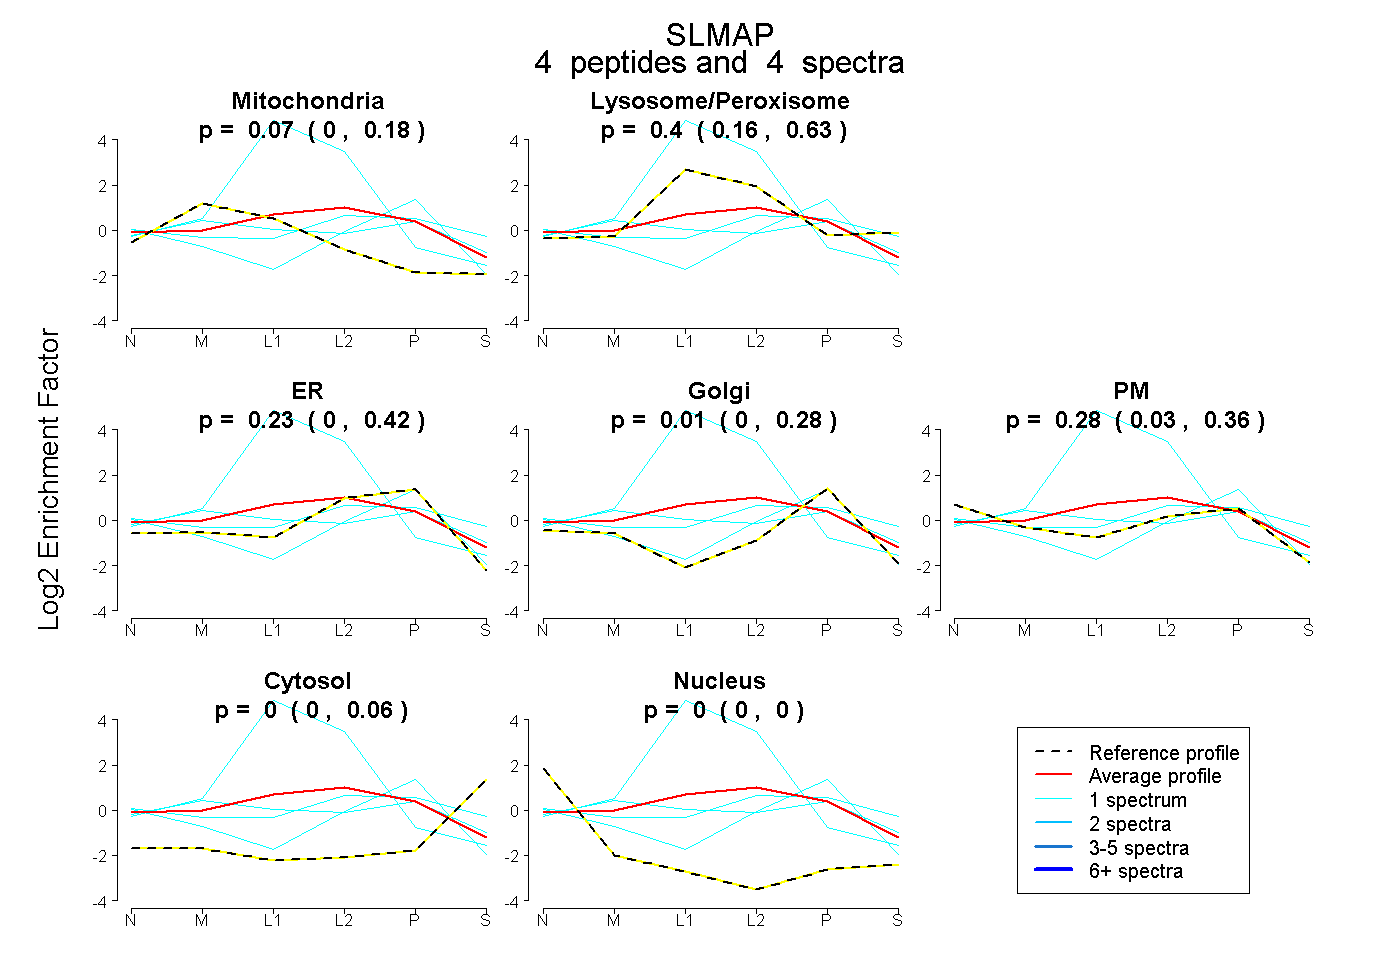 |
0.072 0.000 | 0.180 |
0.405 0.162 | 0.635 |
0.233 0.000 | 0.420 |
0.014 0.000 | 0.283 |
0.277 0.031 | 0.360 |
0.000 0.000 | 0.063 |
0.000 0.000 | 0.000 |
|||
| Plot | Lyso | Other | |||||||||||
| Expt C |
4 peptides |
8 spectra |
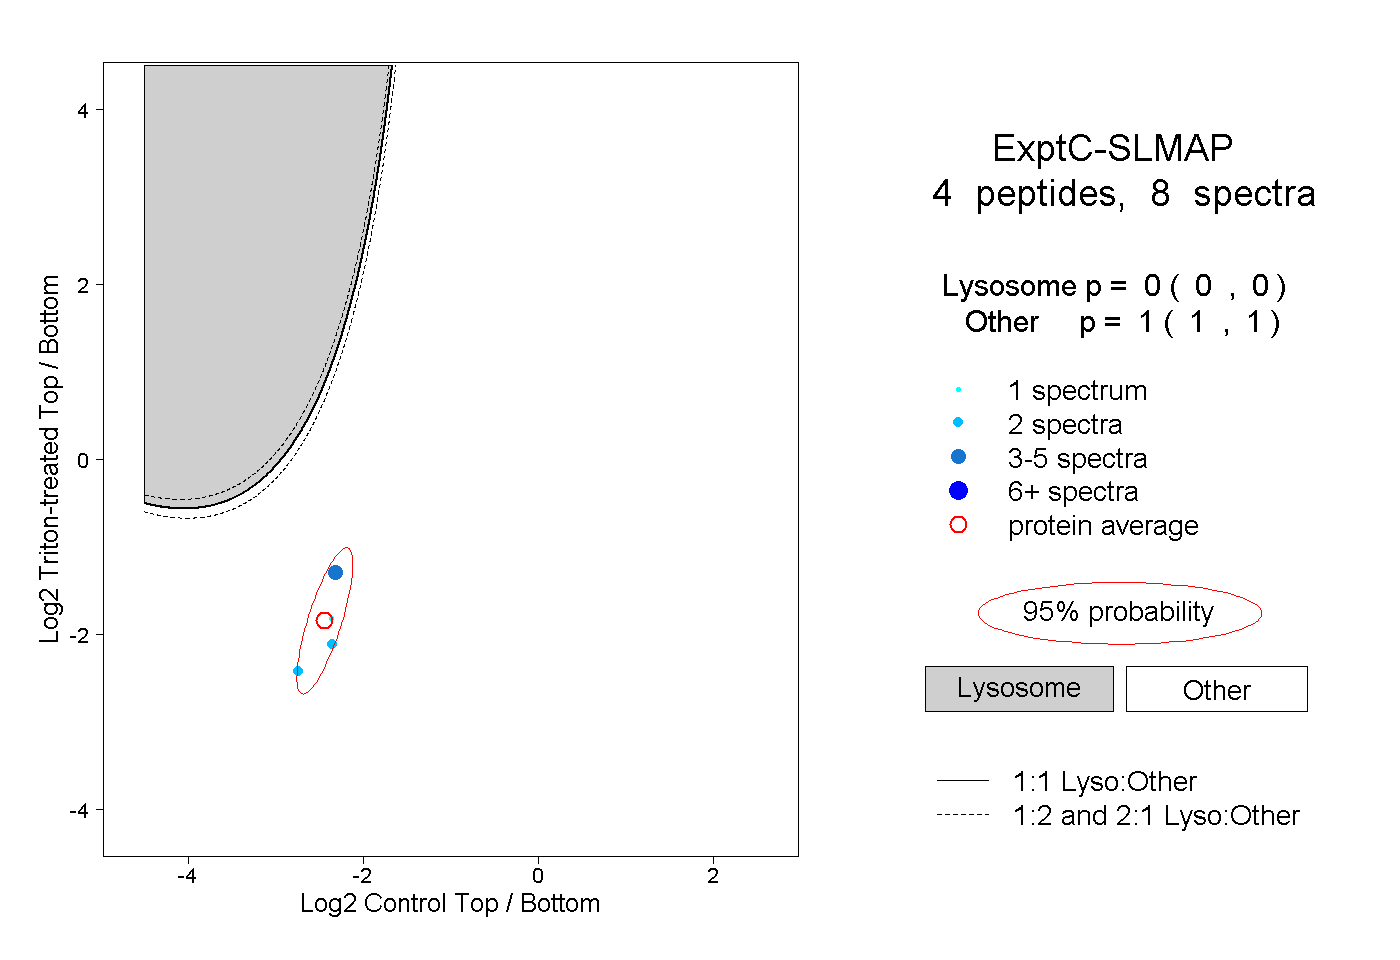 |
0.000 0.000 | 0.000 |
1.000 1.000 | 1.000 |
||||||||
| Plot | Lyso | Other | |||||||||||
| Expt D |
6 peptides |
9 spectra |
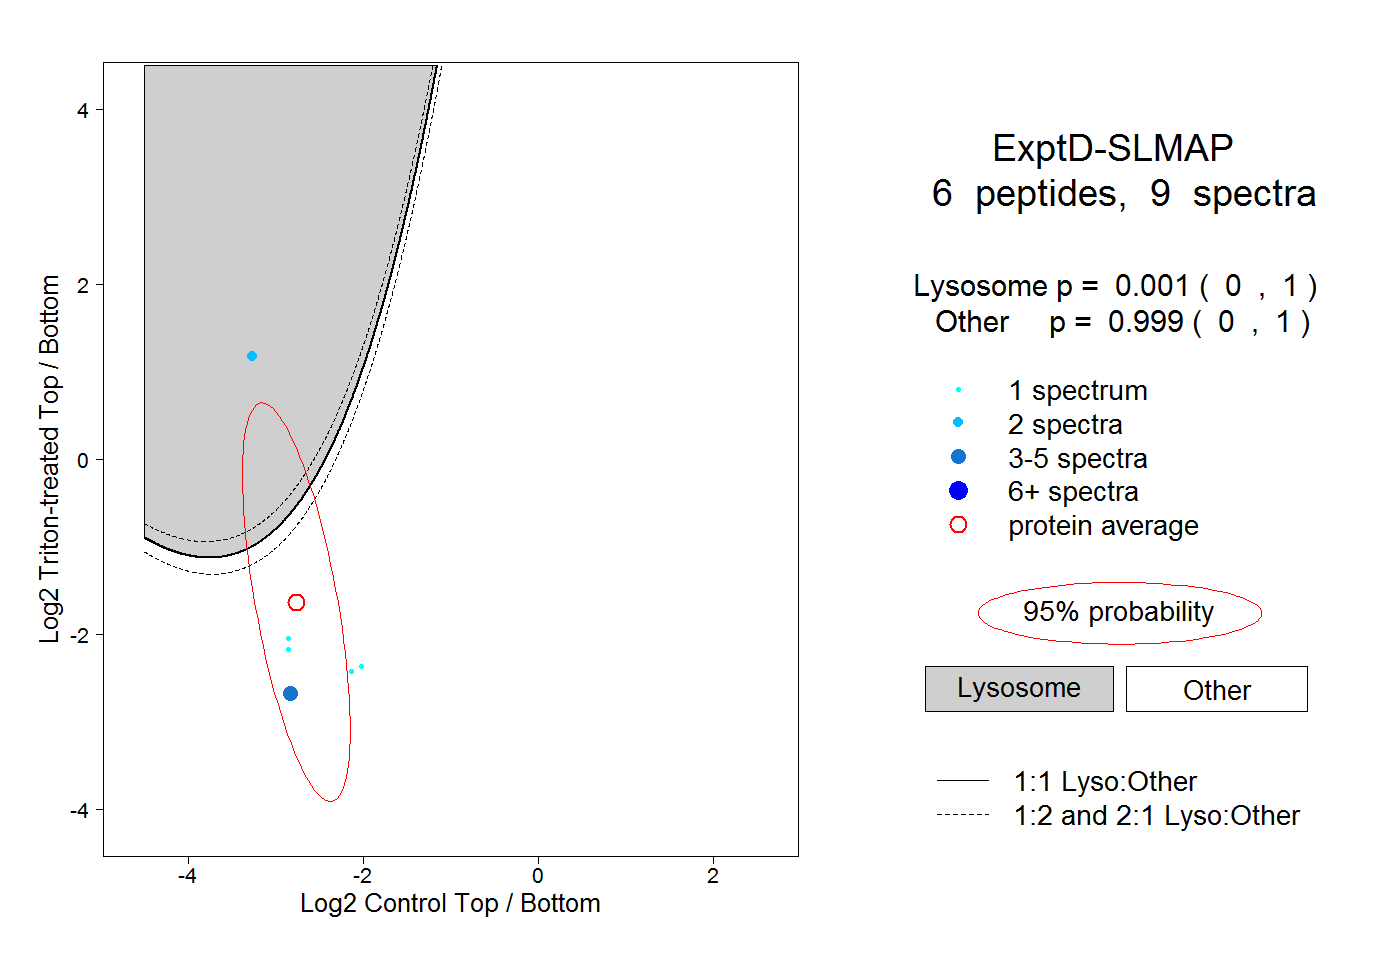 |
0.001 0.000 | 1.000 |
0.999 0.000 | 1.000 |