 22
22peptides
spectra
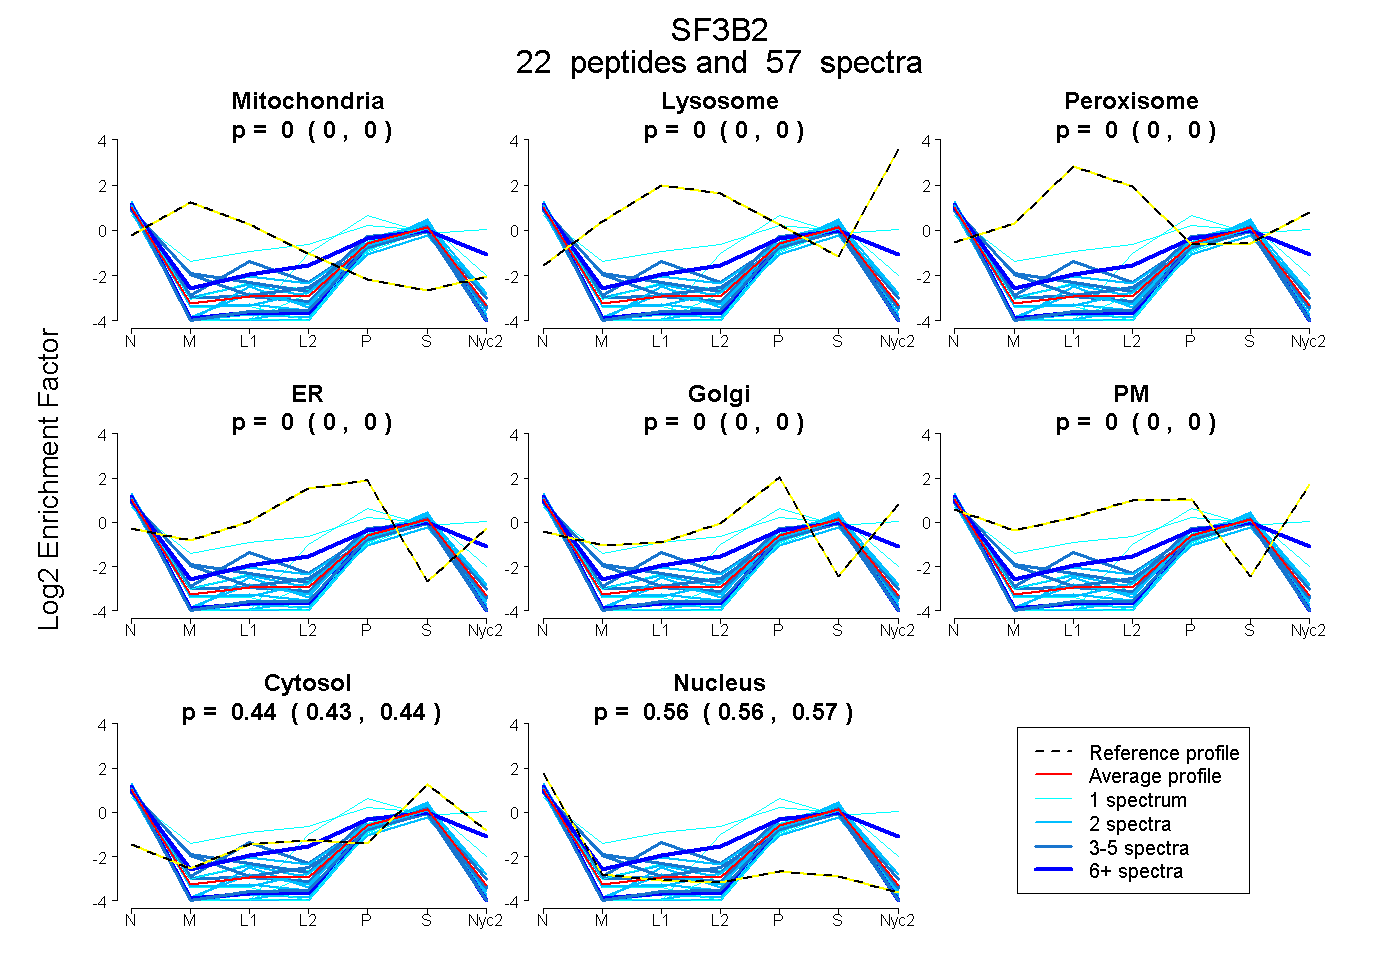
0.000 | 0.000
0.000 | 0.000
0.000 | 0.000
0.000 | 0.000
0.000 | 0.000
0.000 | 0.000
0.432 | 0.441
0.558 | 0.567
3peptides
spectra
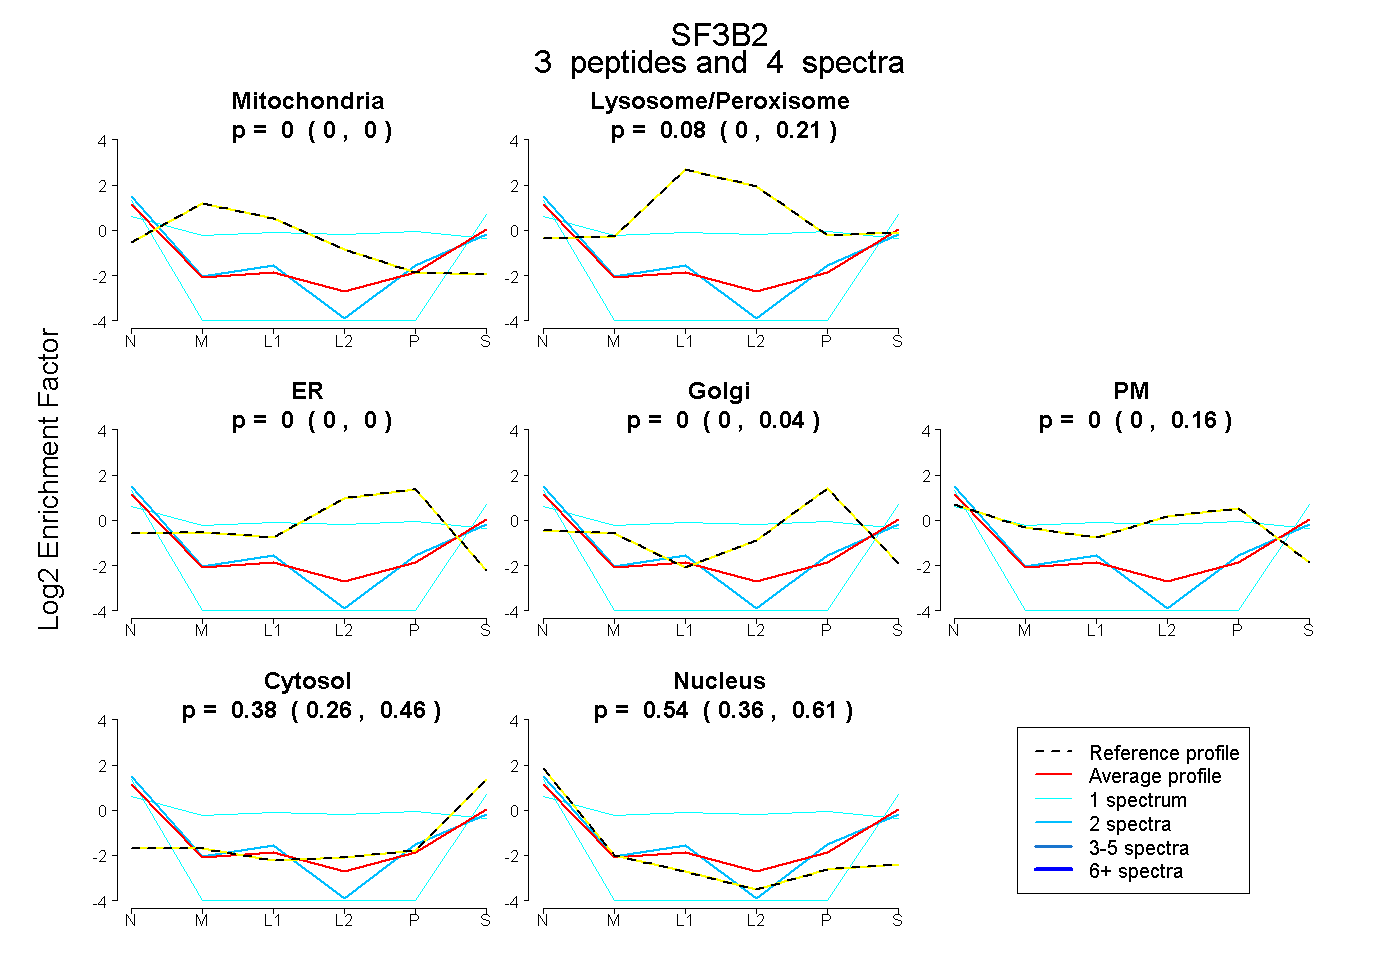
0.000 | 0.000
0.000 | 0.211
0.000 | 0.000
0.000 | 0.038
0.000 | 0.156
0.256 | 0.457
0.360 | 0.606
2peptides
spectra
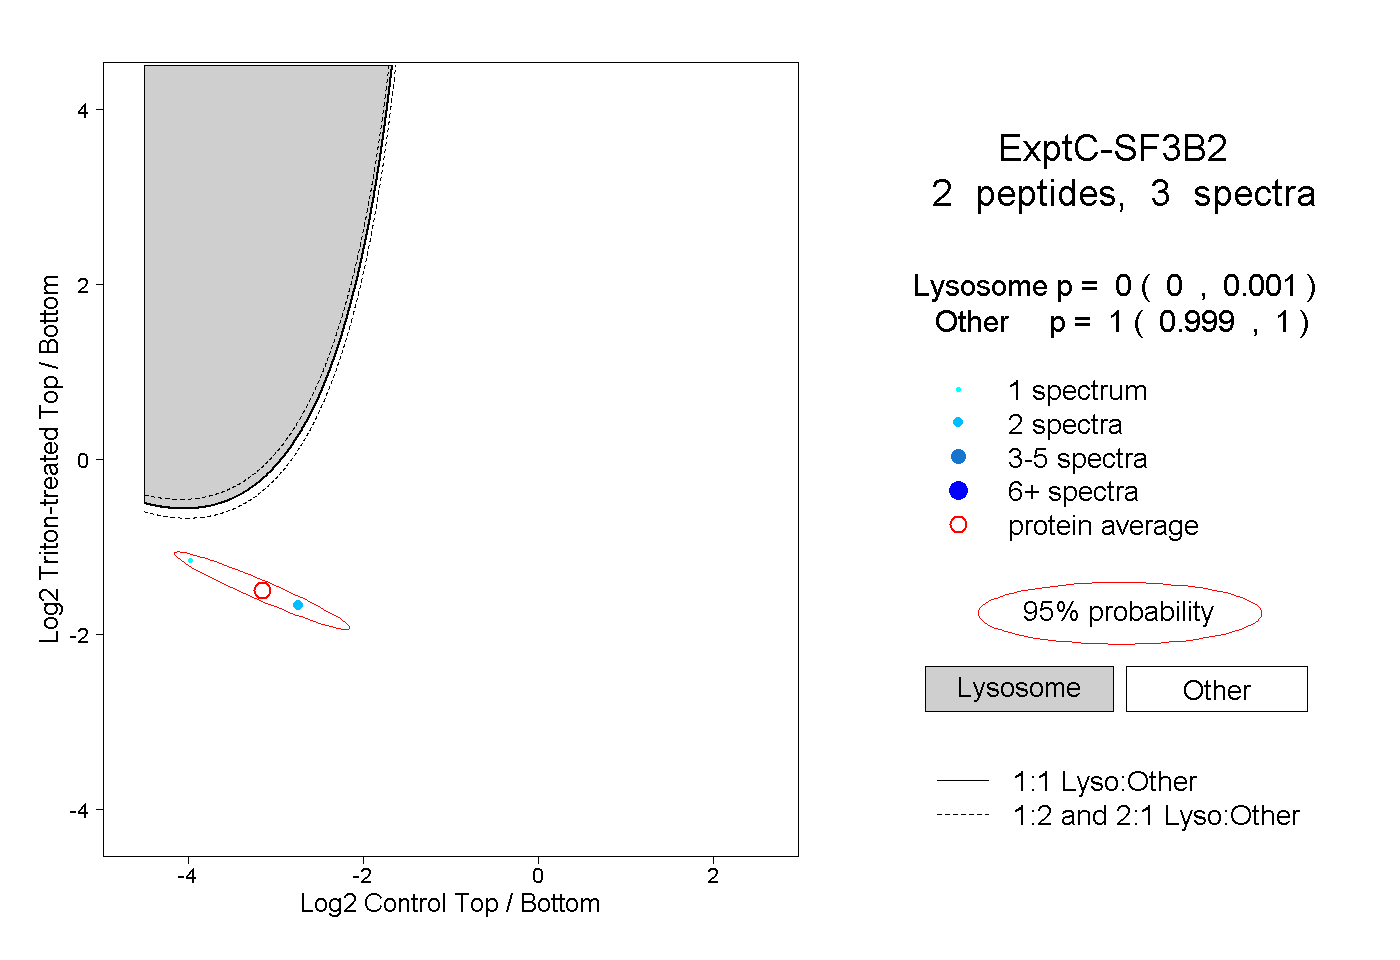
0.000 | 0.001
0.999 | 1.000