 22
22peptides
spectra
0.000 | 0.000
0.000 | 0.000
0.000 | 0.000
0.000 | 0.000
0.000 | 0.000
0.000 | 0.000
0.432 | 0.441
0.558 | 0.567
| Plot | Mito | Lyso | Perox | ER | Golgi | PM | Cytosol | Nucleus | |||||
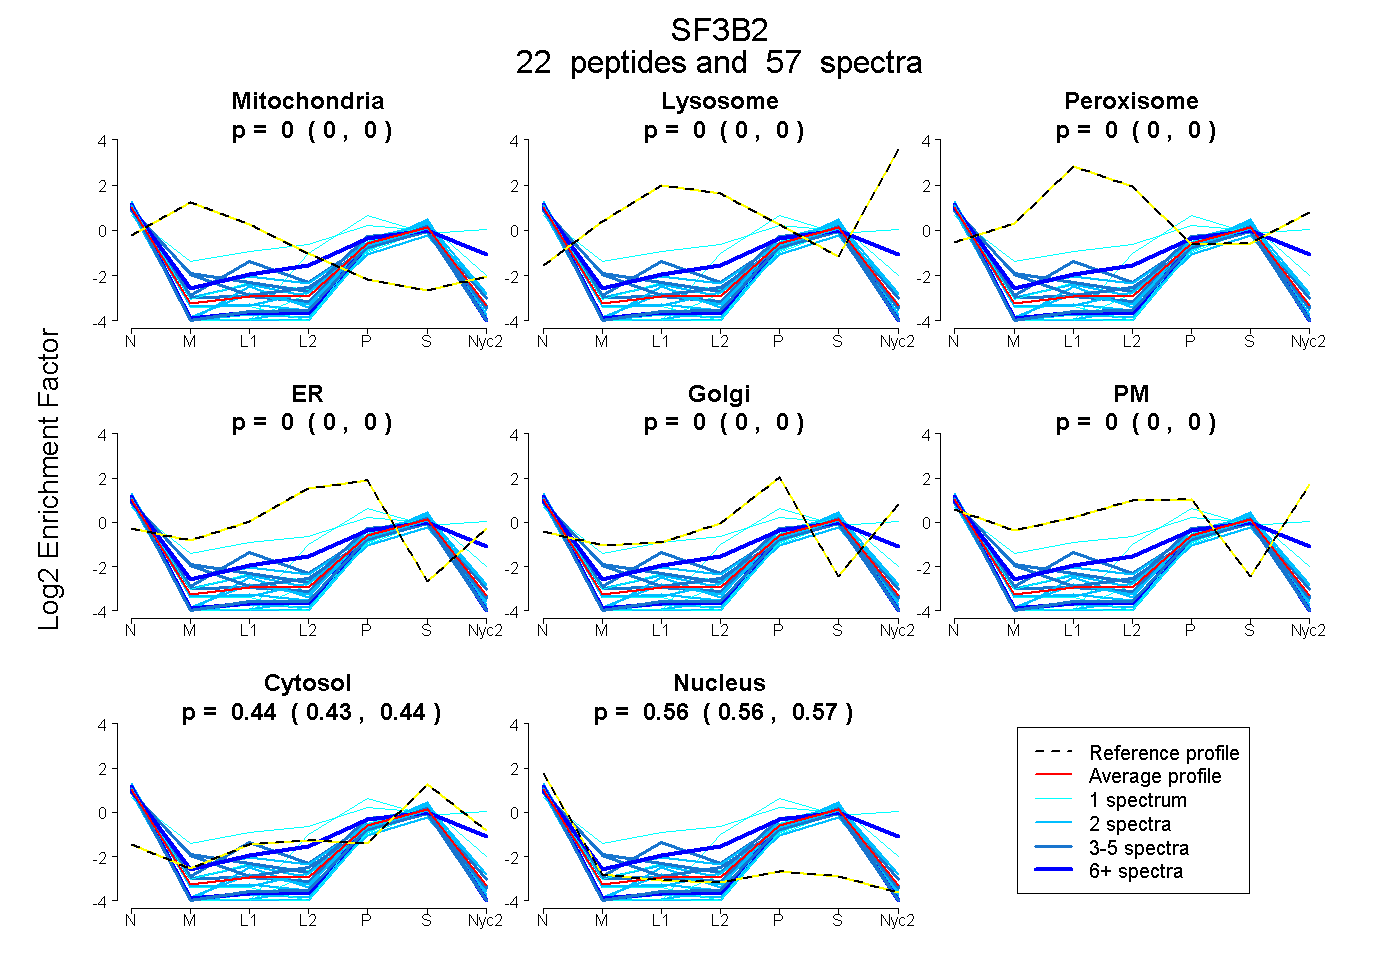
| Expt A |
22 peptides |
57 spectra |
|
0.000 0.000 | 0.000 |
0.000 0.000 | 0.000 |
0.000 0.000 | 0.000 |
0.000 0.000 | 0.000 |
0.000 0.000 | 0.000 |
0.000 0.000 | 0.000 |
0.437 0.432 | 0.441 |
0.563 0.558 | 0.567 |
| 2 spectra, YGPPPSYPNLK | 0.000 | 0.000 | 0.000 | 0.000 | 0.000 | 0.000 | 0.449 | 0.551 | ||
| 4 spectra, IDIDYQK | 0.000 | 0.000 | 0.000 | 0.066 | 0.000 | 0.000 | 0.491 | 0.443 | ||
| 2 spectra, FTVAELK | 0.000 | 0.000 | 0.000 | 0.000 | 0.000 | 0.000 | 0.333 | 0.667 | ||
| 6 spectra, YEEHVR | 0.000 | 0.000 | 0.000 | 0.000 | 0.158 | 0.075 | 0.481 | 0.285 | ||
| 1 spectrum, TPLGPR | 0.000 | 0.000 | 0.000 | 0.000 | 0.000 | 0.000 | 0.317 | 0.683 | ||
| 7 spectra, QTGIVLNRPVLR | 0.000 | 0.000 | 0.000 | 0.000 | 0.000 | 0.000 | 0.313 | 0.687 | ||
| 1 spectrum, KPGDLSDELR | 0.000 | 0.000 | 0.000 | 0.000 | 0.000 | 0.000 | 0.303 | 0.697 | ||
| 2 spectra, MGTAVPRPPQDMGQLGVR | 0.000 | 0.000 | 0.000 | 0.000 | 0.000 | 0.000 | 0.425 | 0.575 | ||
| 2 spectra, IPQALEK | 0.000 | 0.000 | 0.000 | 0.000 | 0.000 | 0.000 | 0.454 | 0.546 | ||
| 2 spectra, QAAVLMEQER | 0.000 | 0.000 | 0.000 | 0.000 | 0.000 | 0.000 | 0.451 | 0.549 | ||
| 2 spectra, LTIHGDLYYEGK | 0.000 | 0.000 | 0.000 | 0.032 | 0.000 | 0.000 | 0.543 | 0.425 | ||
| 5 spectra, VPPPWLIAMQR | 0.000 | 0.000 | 0.000 | 0.048 | 0.017 | 0.000 | 0.420 | 0.515 | ||
| 2 spectra, LAEIGAPIQGSR | 0.000 | 0.000 | 0.000 | 0.000 | 0.000 | 0.000 | 0.332 | 0.668 | ||
| 1 spectrum, IFEAFK | 0.000 | 0.000 | 0.000 | 0.000 | 0.000 | 0.000 | 0.493 | 0.507 | ||
| 1 spectrum, EDFSDMVAEHAAK | 0.000 | 0.000 | 0.000 | 0.000 | 0.339 | 0.000 | 0.421 | 0.240 | ||
| 1 spectrum, EMDDPSVGPK | 0.060 | 0.000 | 0.000 | 0.298 | 0.000 | 0.000 | 0.330 | 0.312 | ||
| 5 spectra, ISLGMPVGPNAHK | 0.000 | 0.000 | 0.000 | 0.000 | 0.000 | 0.000 | 0.418 | 0.582 | ||
| 2 spectra, GPPPPPGDENR | 0.000 | 0.000 | 0.000 | 0.000 | 0.000 | 0.000 | 0.299 | 0.701 | ||
| 1 spectrum, LHDAFFK | 0.000 | 0.000 | 0.000 | 0.000 | 0.000 | 0.000 | 0.409 | 0.591 | ||
| 3 spectra, VGEPVALSEEER | 0.000 | 0.000 | 0.000 | 0.000 | 0.000 | 0.000 | 0.335 | 0.665 | ||
| 3 spectra, TGIQEMR | 0.000 | 0.000 | 0.000 | 0.000 | 0.000 | 0.000 | 0.404 | 0.596 | ||
| 2 spectra, AASSESSGDR | 0.000 | 0.000 | 0.000 | 0.000 | 0.000 | 0.000 | 0.300 | 0.700 |
| Plot | Mito | Lyso or Perox | ER | Golgi | PM | Cytosol | Nucleus | ||||||
| Expt B |
3 peptides |
4 spectra |
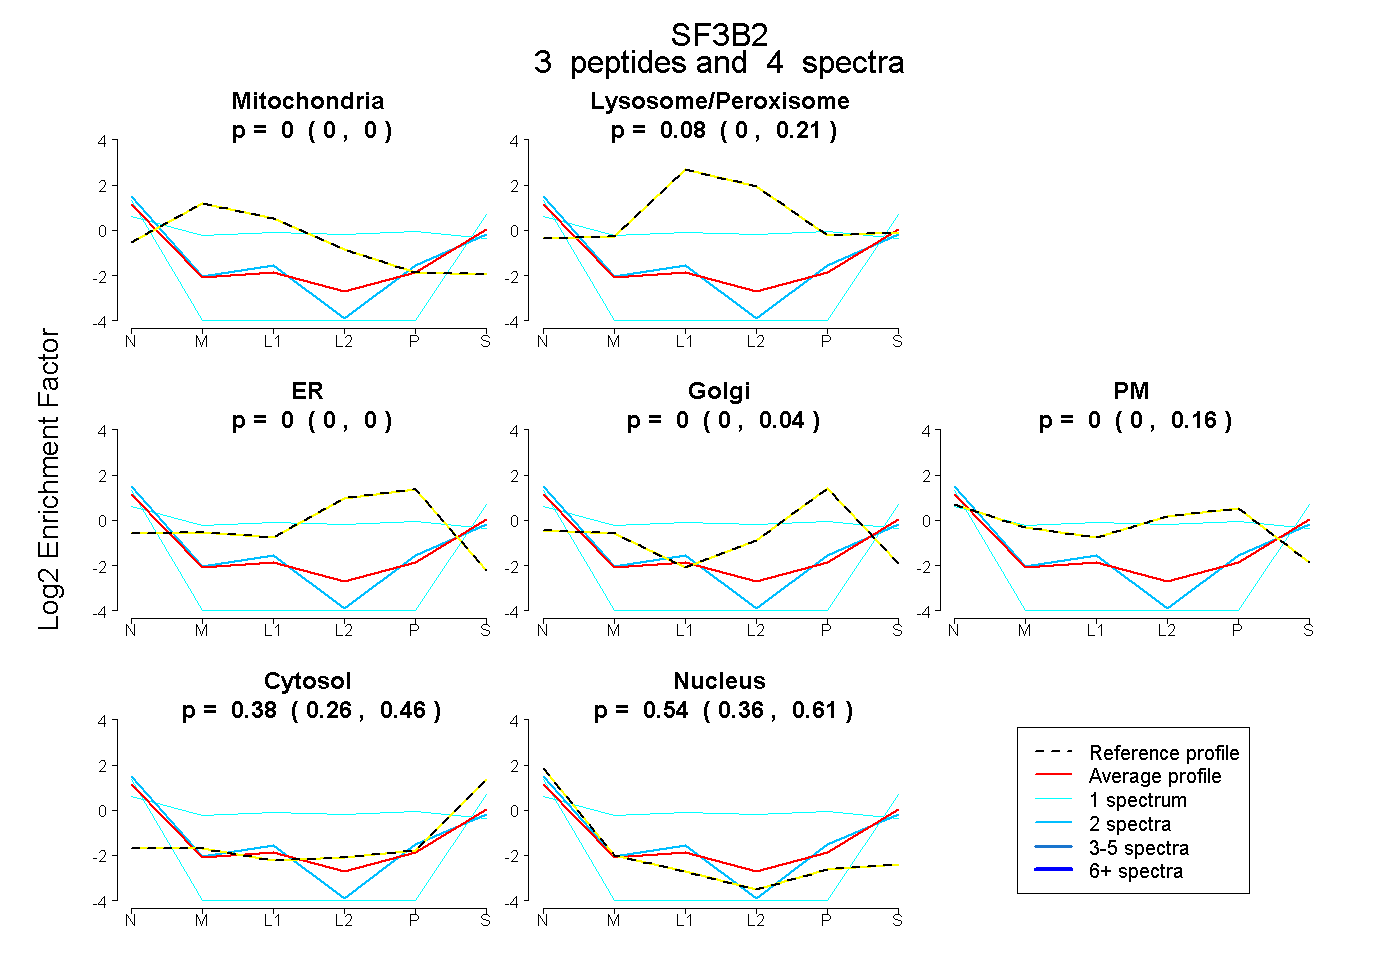 |
0.000 0.000 | 0.000 |
0.083 0.000 | 0.211 |
0.000 0.000 | 0.000 |
0.000 0.000 | 0.038 |
0.000 0.000 | 0.156 |
0.381 0.256 | 0.457 |
0.536 0.360 | 0.606 |
|||
| Plot | Lyso | Other | |||||||||||
| Expt C |
2 peptides |
3 spectra |
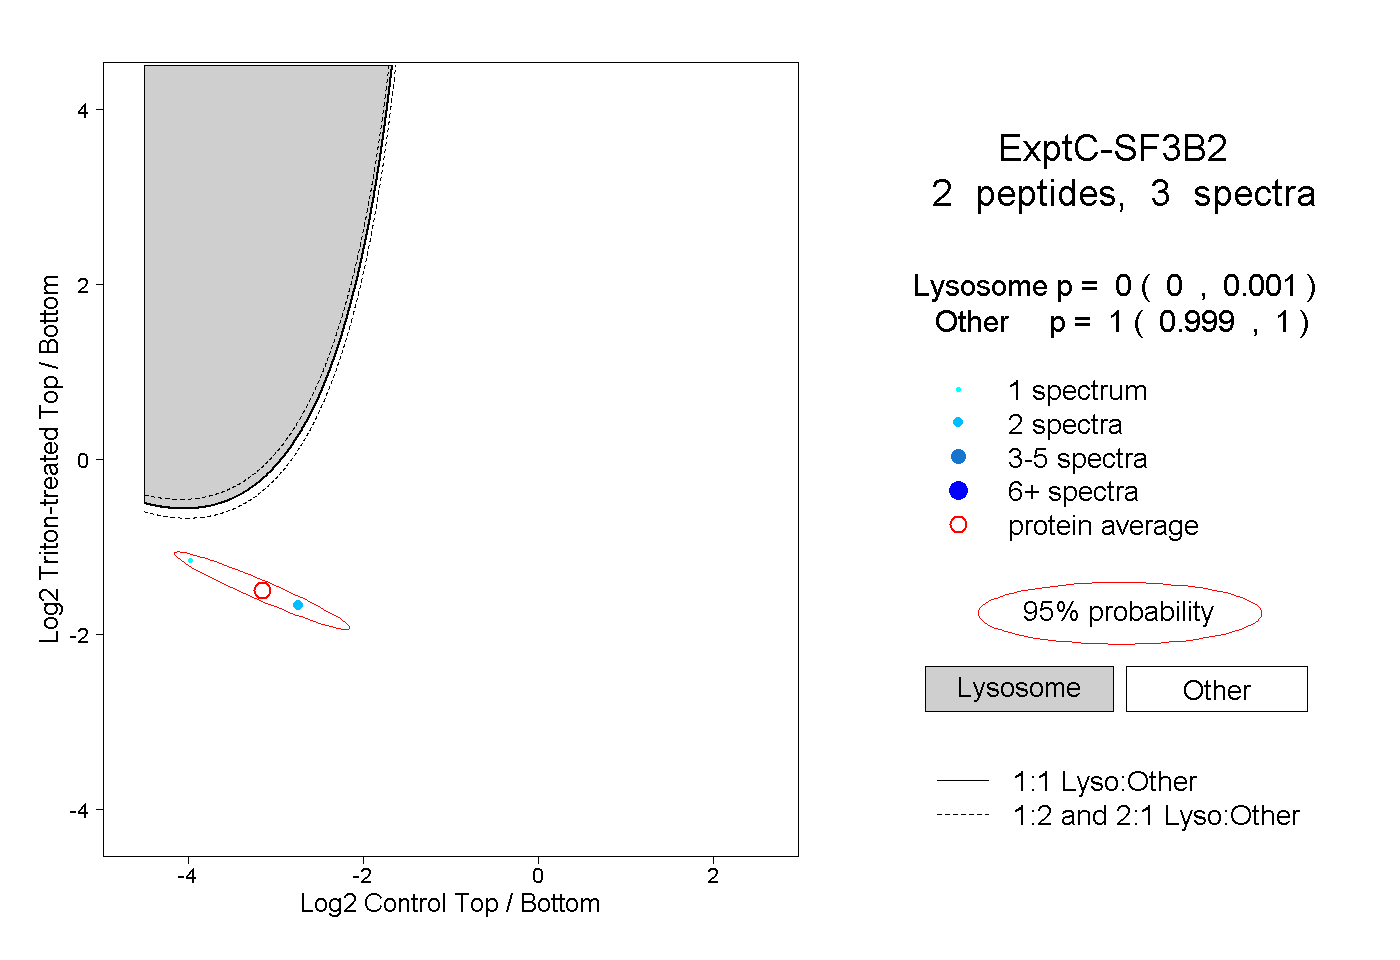 |
0.000 0.000 | 0.001 |
1.000 0.999 | 1.000 |