 14
14peptides
spectra
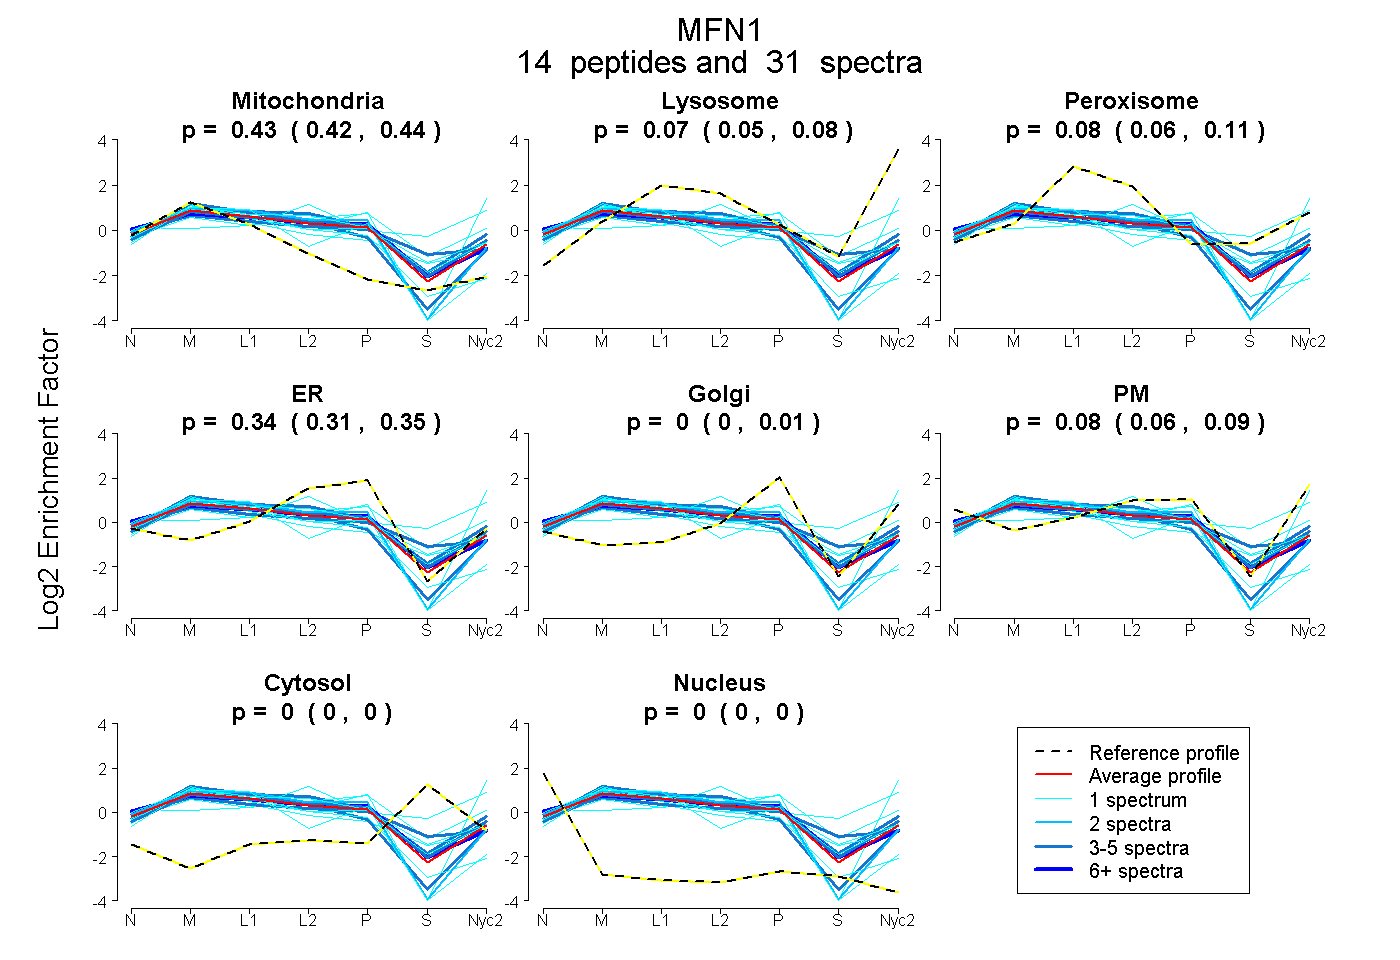
0.423 | 0.442
0.048 | 0.078
0.060 | 0.108
0.313 | 0.354
0.000 | 0.013
0.059 | 0.092
0.000 | 0.000
0.000 | 0.000
7peptides
spectra
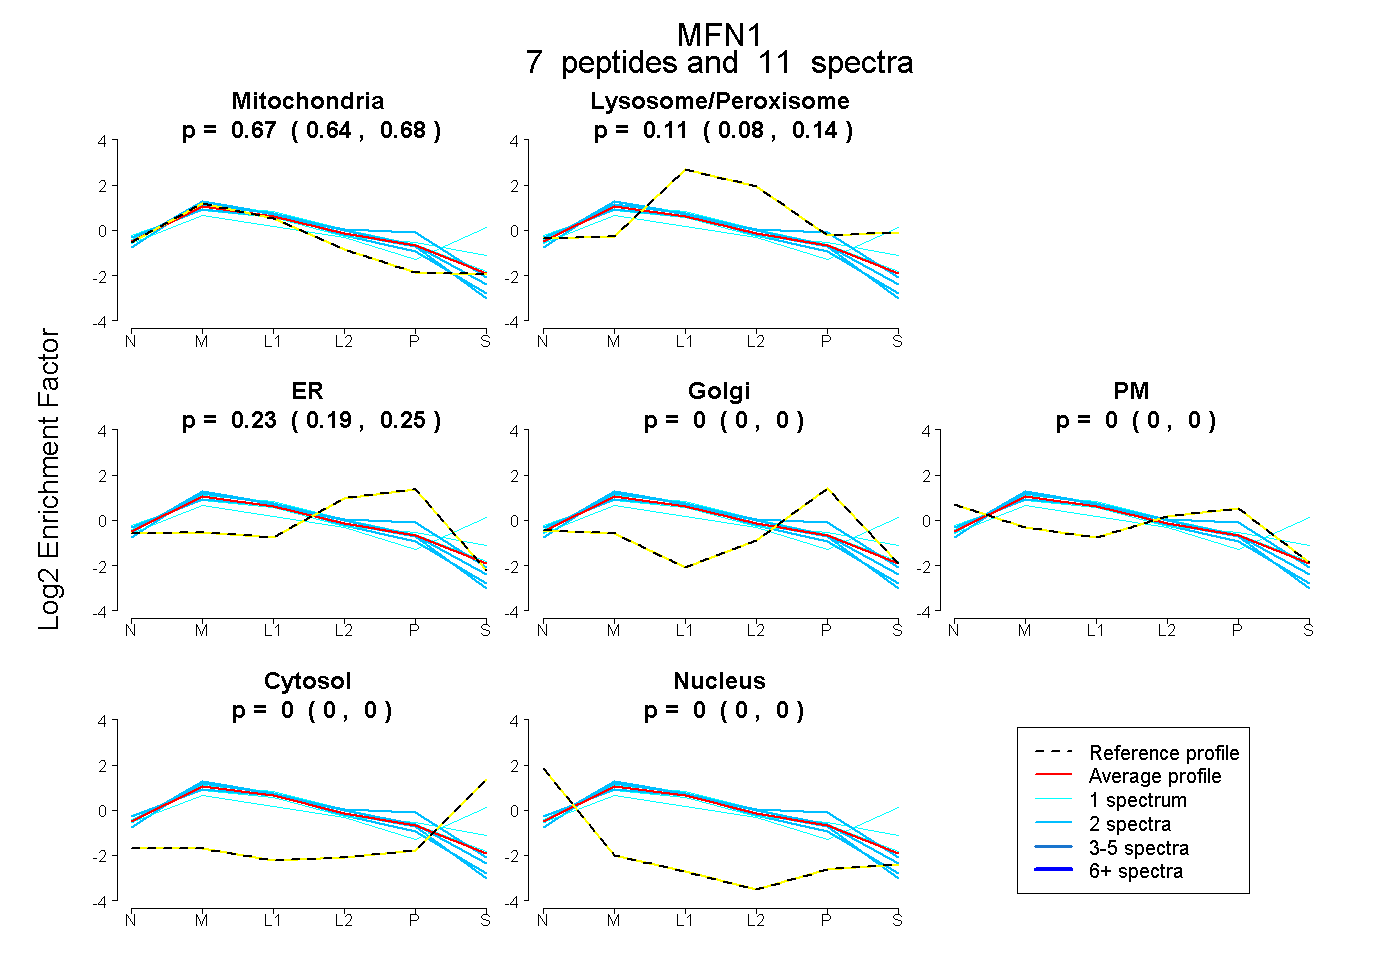
0.643 | 0.683
0.076 | 0.137
0.191 | 0.247
0.000 | 0.000
0.000 | 0.000
0.000 | 0.000
0.000 | 0.000
22peptides
spectra
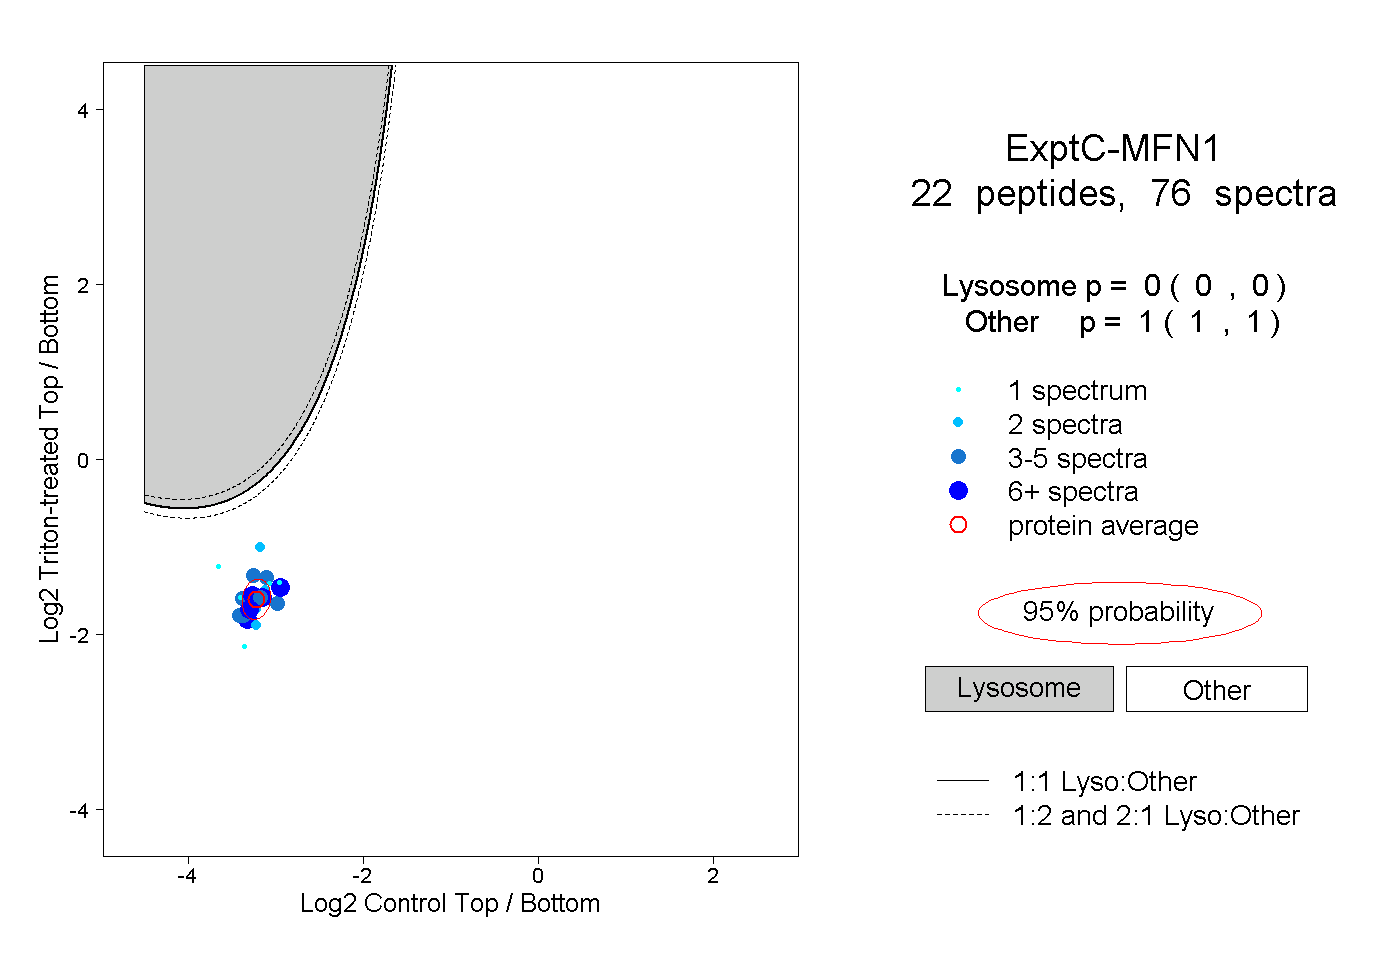
0.000 | 0.000
1.000 | 1.000
6peptides
spectra
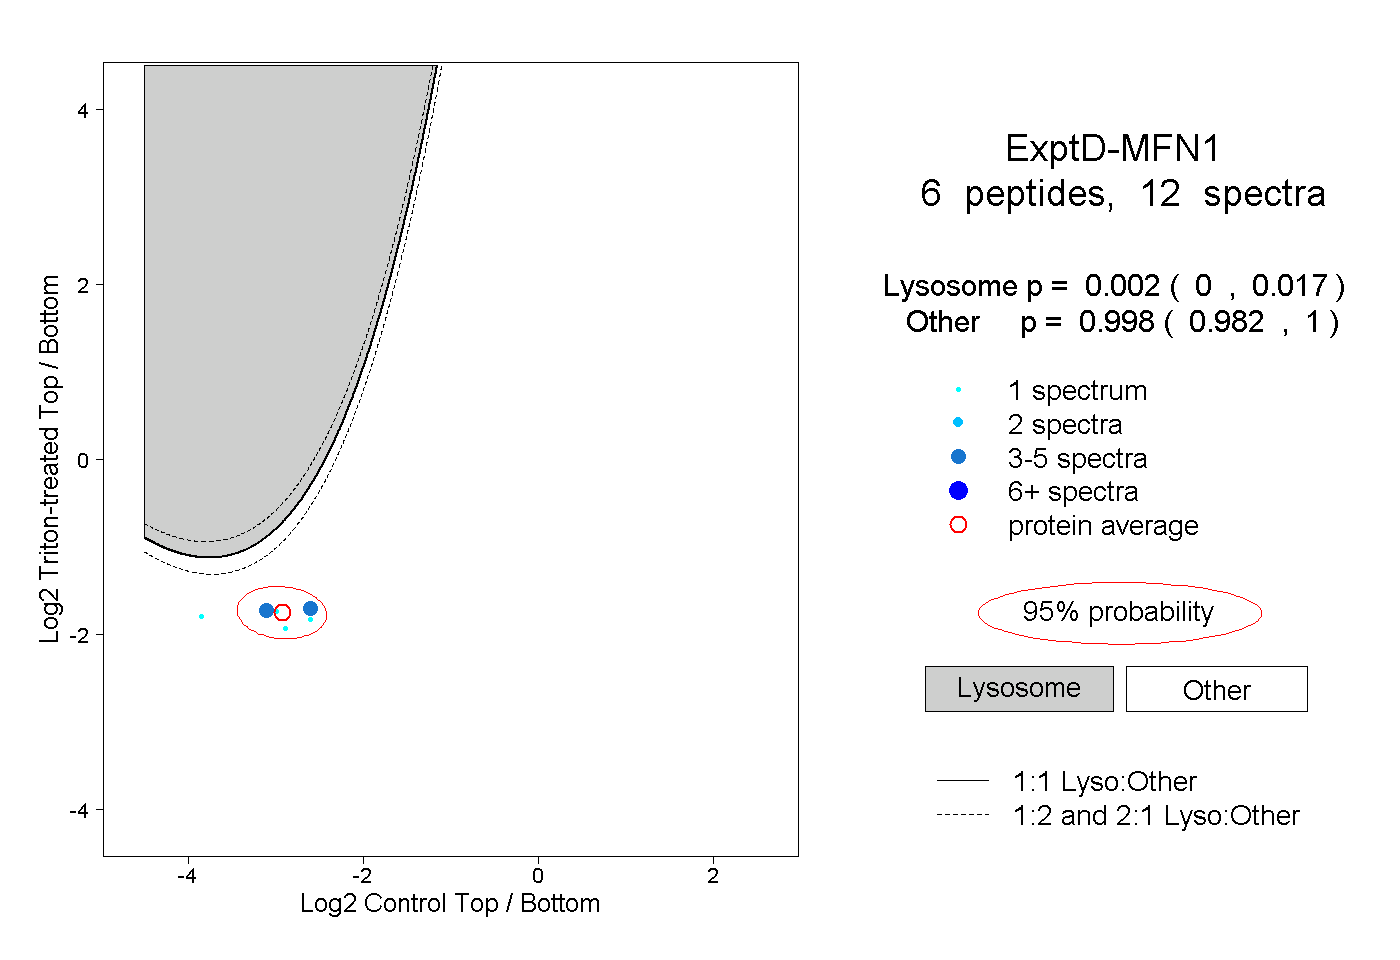
0.000 | 0.017
0.982 | 1.000