 14
14peptides
spectra
0.423 | 0.442
0.048 | 0.078
0.060 | 0.108
0.313 | 0.354
0.000 | 0.013
0.059 | 0.092
0.000 | 0.000
0.000 | 0.000
| Plot | Mito | Lyso | Perox | ER | Golgi | PM | Cytosol | Nucleus | |||||
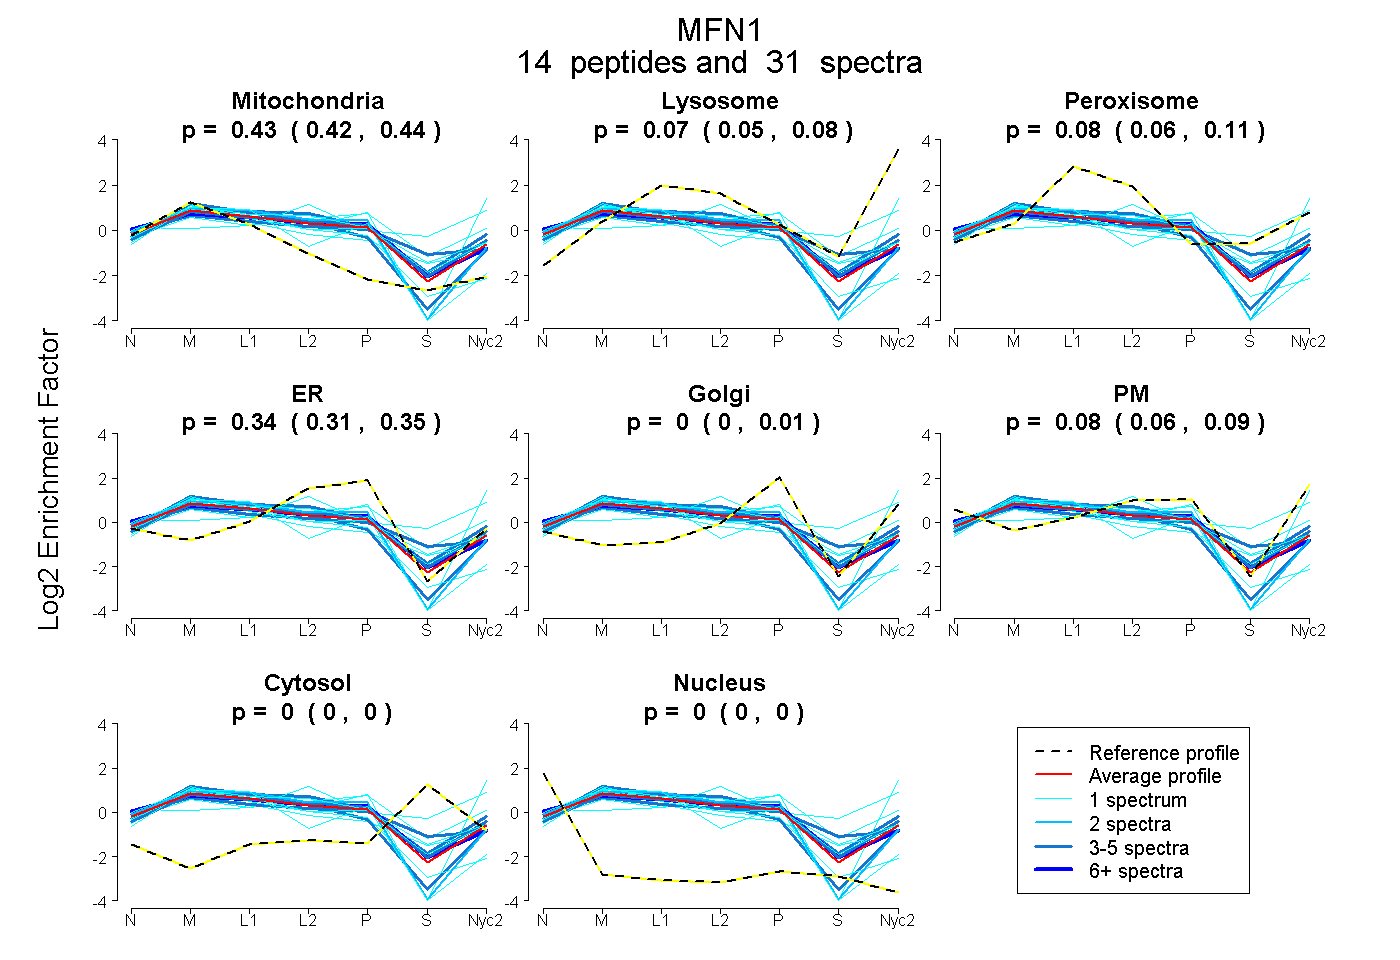
| Expt A |
14 peptides |
31 spectra |
|
0.434 0.423 | 0.442 |
0.066 0.048 | 0.078 |
0.083 0.060 | 0.108 |
0.339 0.313 | 0.354 |
0.000 0.000 | 0.013 |
0.078 0.059 | 0.092 |
0.000 0.000 | 0.000 |
0.000 0.000 | 0.000 |
| 1 spectrum, AQGMPEGGGALAEGFQAR | 0.000 | 0.000 | 0.354 | 0.000 | 0.000 | 0.422 | 0.225 | 0.000 | ||
| 4 spectra, IFFVSAK | 0.558 | 0.085 | 0.000 | 0.330 | 0.000 | 0.027 | 0.000 | 0.000 | ||
| 1 spectrum, HFVLAK | 0.221 | 0.115 | 0.000 | 0.000 | 0.019 | 0.645 | 0.000 | 0.000 | ||
| 4 spectra, AGCLVHVFWPK | 0.309 | 0.000 | 0.261 | 0.212 | 0.000 | 0.219 | 0.000 | 0.000 | ||
| 1 spectrum, VLLGLSEPIFQVPR | 0.630 | 0.000 | 0.000 | 0.370 | 0.000 | 0.000 | 0.000 | 0.000 | ||
| 1 spectrum, EVTEEVANK | 0.182 | 0.000 | 0.335 | 0.013 | 0.456 | 0.000 | 0.014 | 0.000 | ||
| 2 spectra, LTWTTR | 0.428 | 0.000 | 0.000 | 0.462 | 0.000 | 0.110 | 0.000 | 0.000 | ||
| 3 spectra, LSKPNIFILNNR | 0.401 | 0.141 | 0.070 | 0.367 | 0.021 | 0.000 | 0.000 | 0.000 | ||
| 1 spectrum, VSCAMTDEICR | 0.392 | 0.000 | 0.306 | 0.000 | 0.302 | 0.000 | 0.000 | 0.000 | ||
| 1 spectrum, LCSDFQEDIVFR | 0.651 | 0.000 | 0.000 | 0.349 | 0.000 | 0.000 | 0.000 | 0.000 | ||
| 1 spectrum, NQMNLLTMDVK | 0.399 | 0.127 | 0.143 | 0.332 | 0.000 | 0.000 | 0.000 | 0.000 | ||
| 4 spectra, HIEDGMGR | 0.363 | 0.000 | 0.239 | 0.182 | 0.119 | 0.000 | 0.097 | 0.000 | ||
| 6 spectra, HLEEEIAR | 0.405 | 0.000 | 0.146 | 0.357 | 0.026 | 0.066 | 0.000 | 0.000 | ||
| 1 spectrum, FLGSTNAQR | 0.520 | 0.000 | 0.233 | 0.000 | 0.217 | 0.000 | 0.031 | 0.000 |
| Plot | Mito | Lyso or Perox | ER | Golgi | PM | Cytosol | Nucleus | ||||||
| Expt B |
7 peptides |
11 spectra |
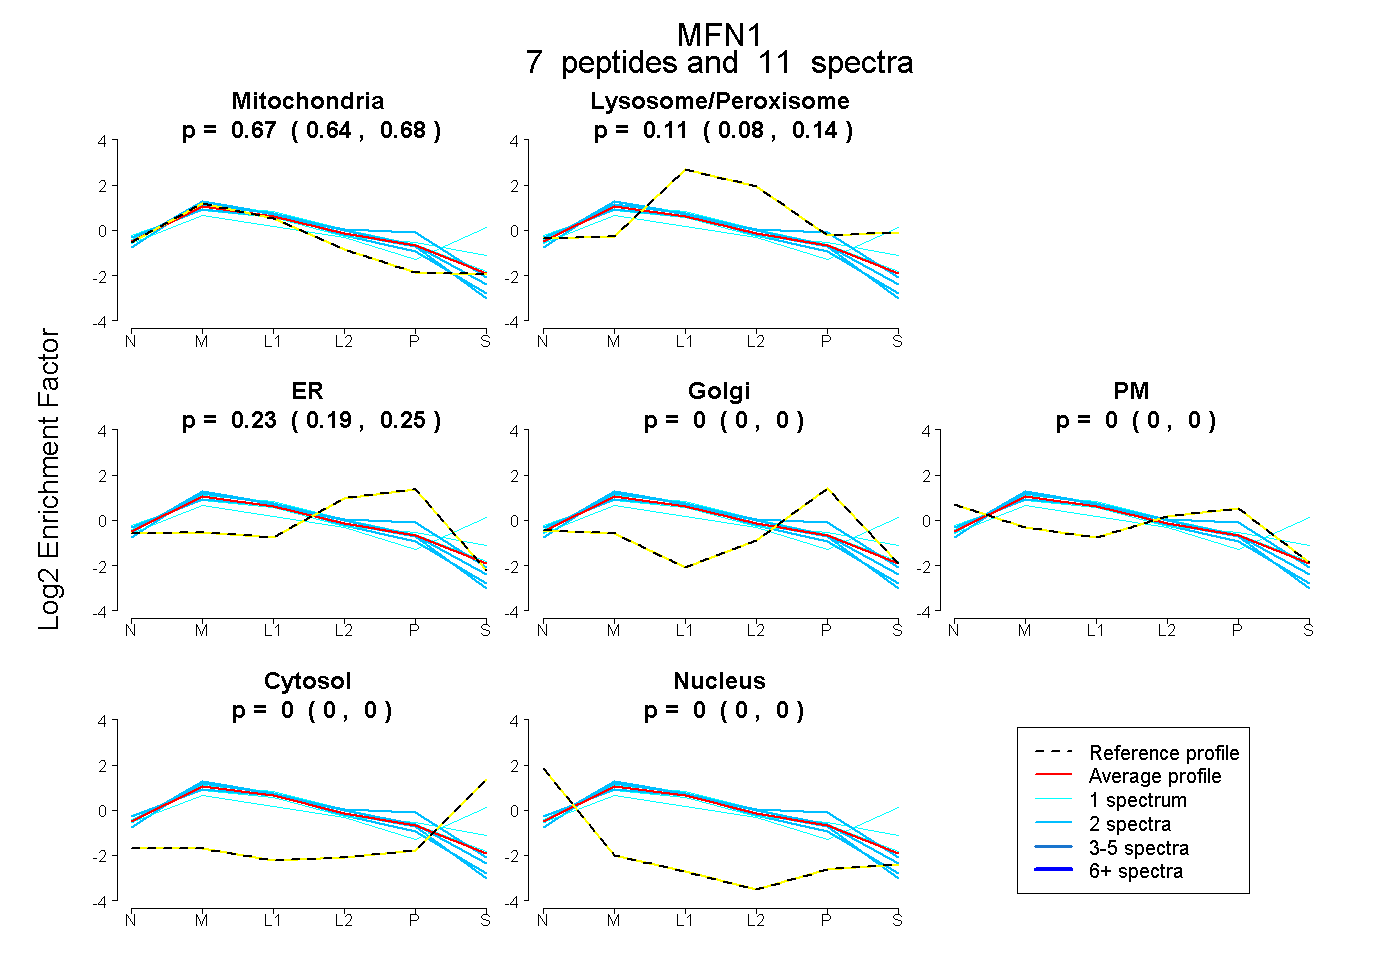 |
0.666 0.643 | 0.683 |
0.108 0.076 | 0.137 |
0.226 0.191 | 0.247 |
0.000 0.000 | 0.000 |
0.000 0.000 | 0.000 |
0.000 0.000 | 0.000 |
0.000 0.000 | 0.000 |
|||
| Plot | Lyso | Other | |||||||||||
| Expt C |
22 peptides |
76 spectra |
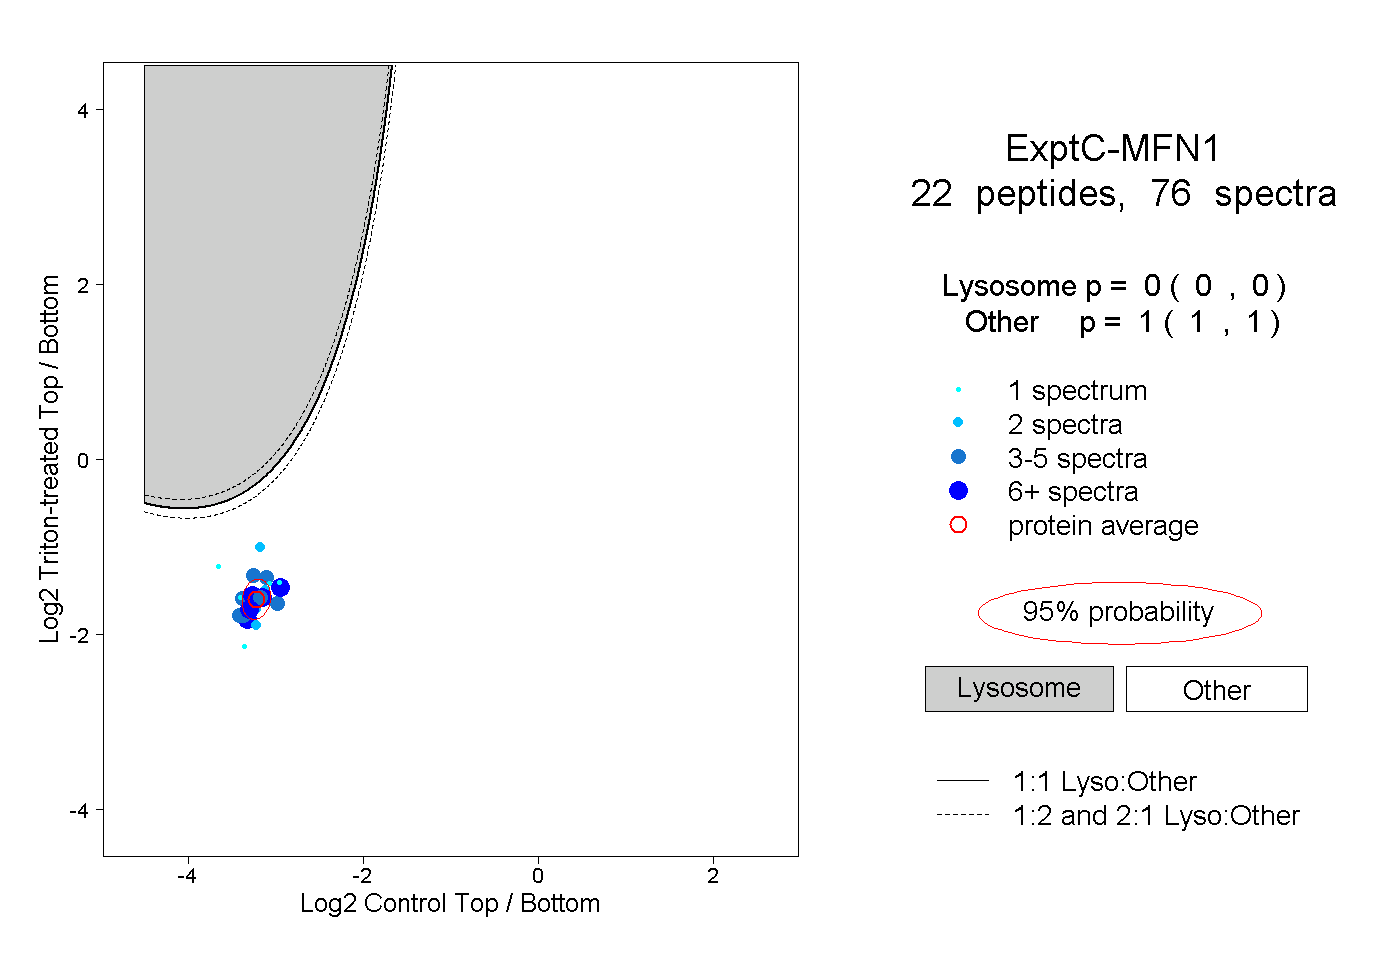 |
0.000 0.000 | 0.000 |
1.000 1.000 | 1.000 |
||||||||
| Plot | Lyso | Other | |||||||||||
| Expt D |
6 peptides |
12 spectra |
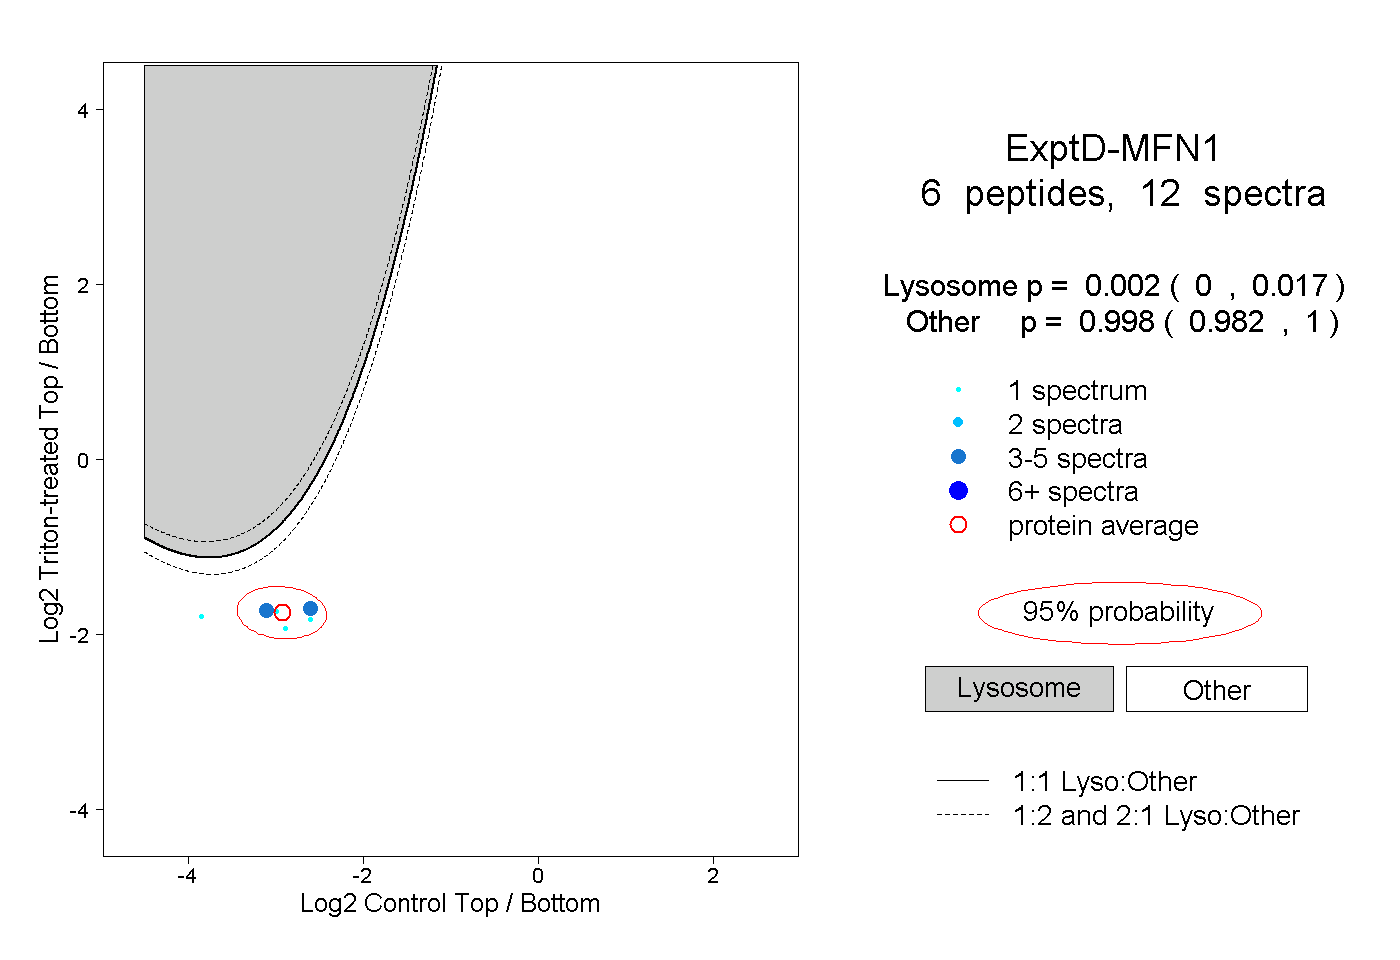 |
0.002 0.000 | 0.017 |
0.998 0.982 | 1.000 |