 8
8peptides
spectra
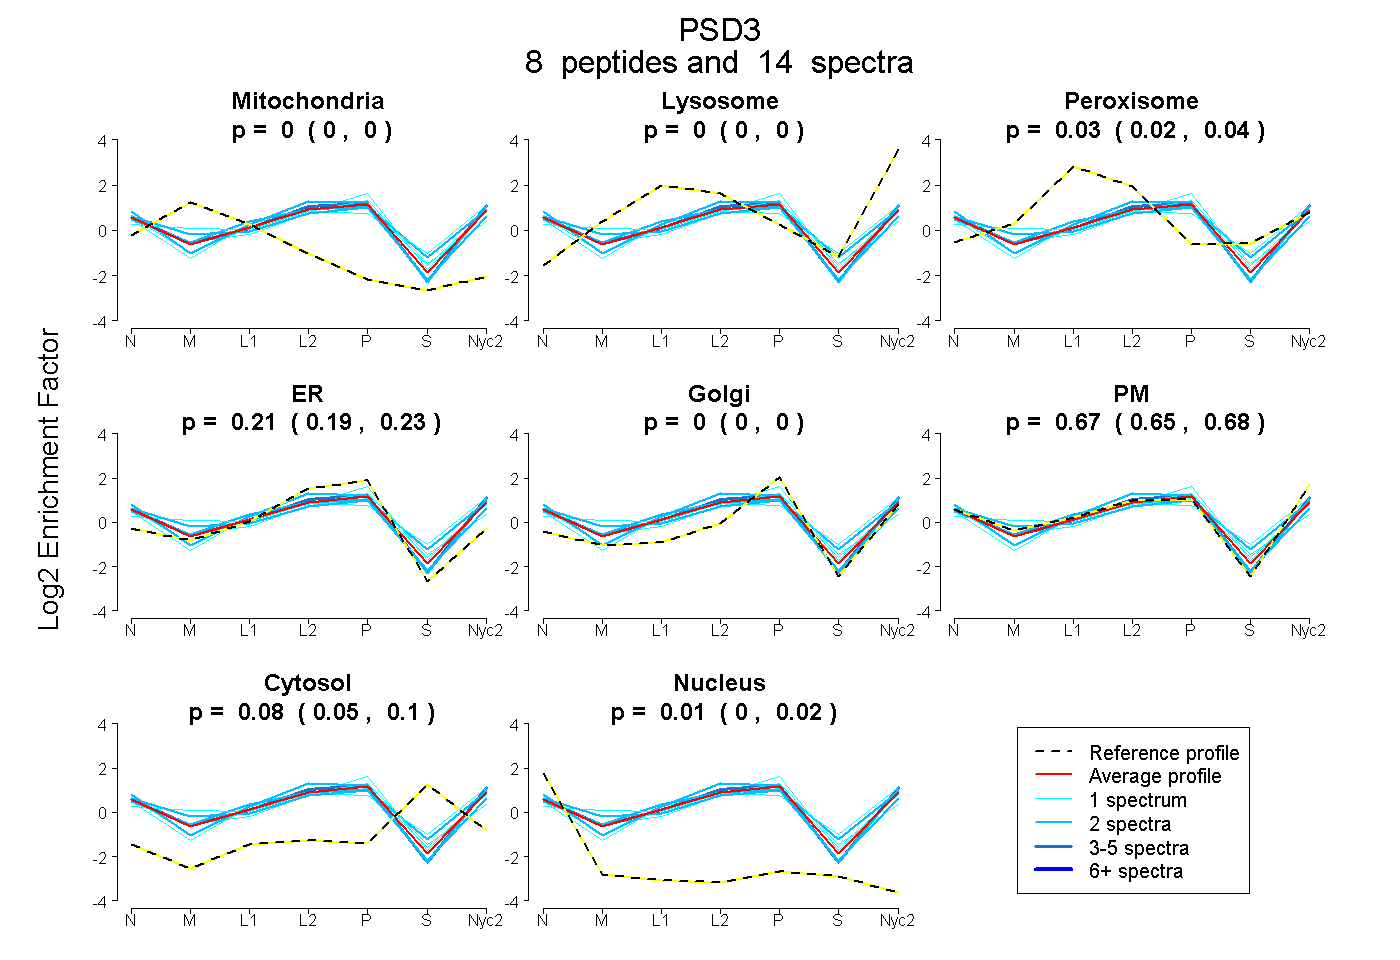
0.000 | 0.000
0.000 | 0.000
0.018 | 0.042
0.193 | 0.229
0.000 | 0.000
0.648 | 0.684
0.053 | 0.098
0.000 | 0.022
1peptide
spectra
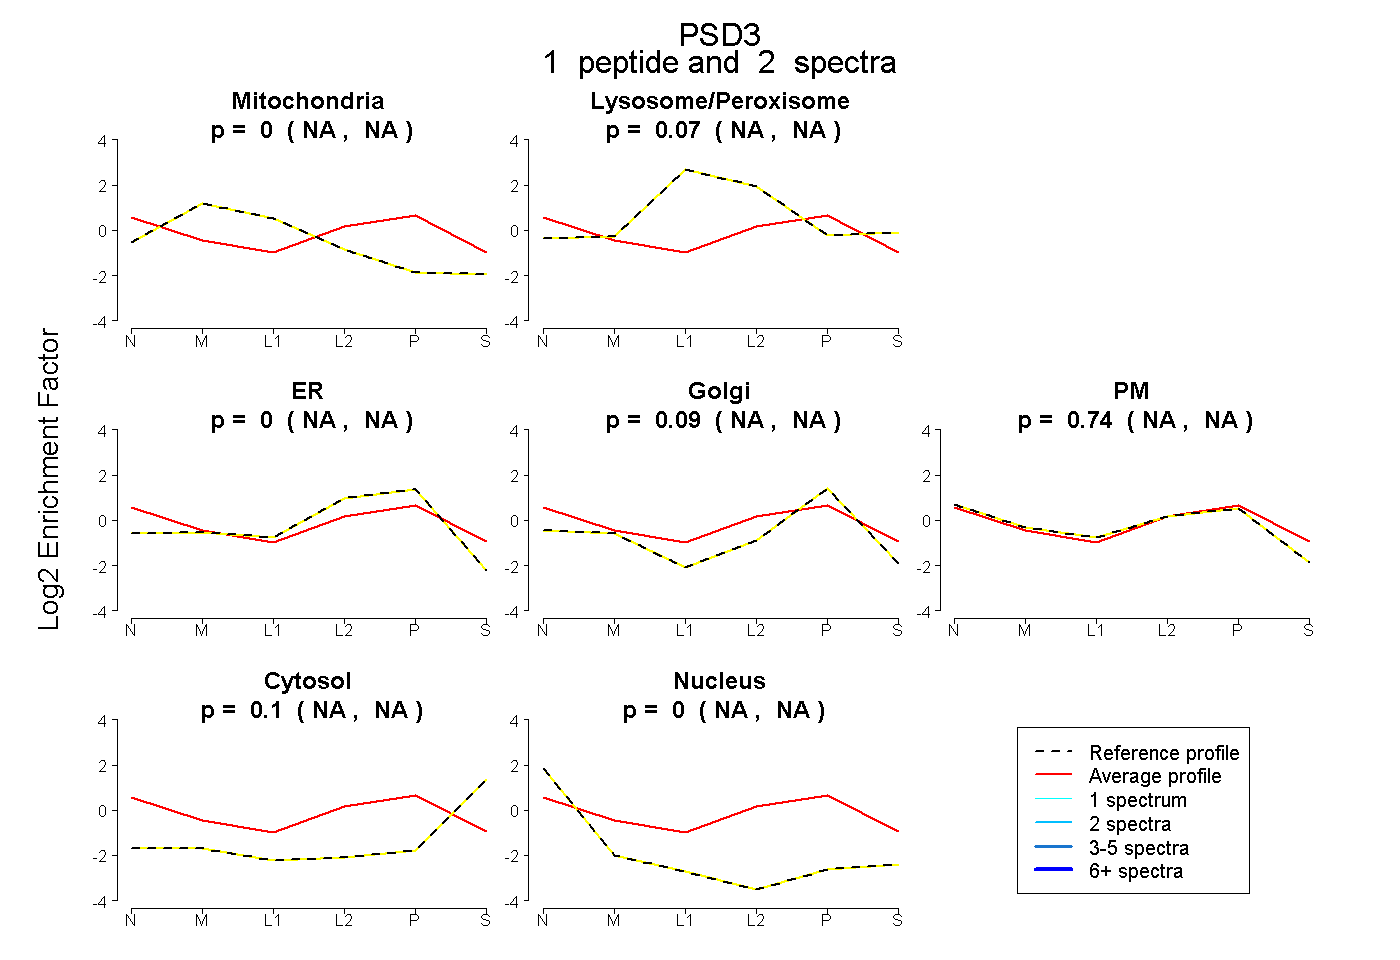
NA | NA
NA | NA
NA | NA
NA | NA
NA | NA
NA | NA
NA | NA
8peptides
spectra
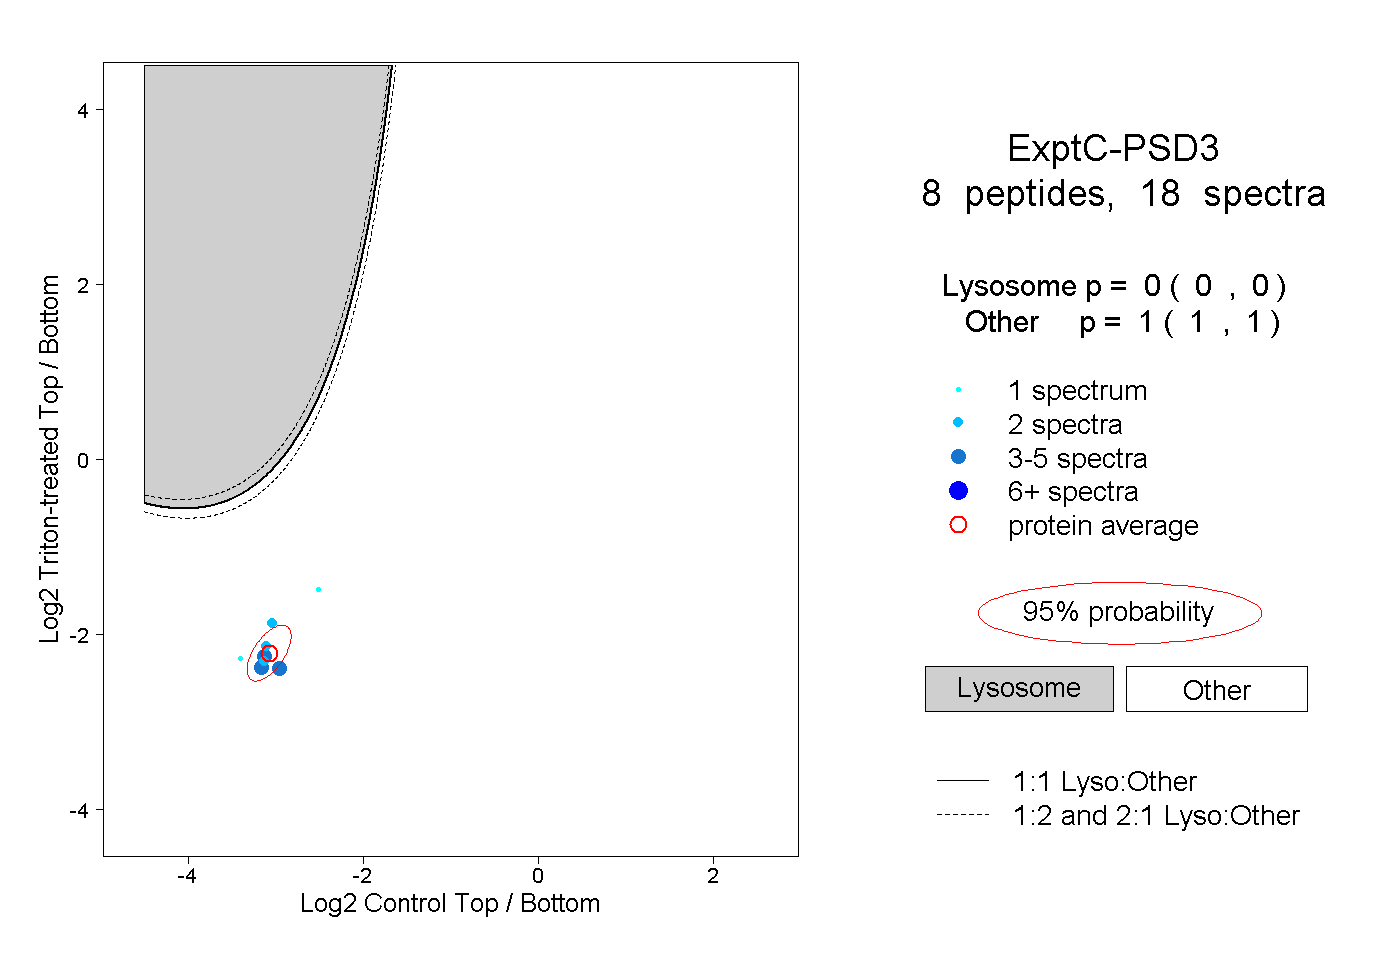
0.000 | 0.000
1.000 | 1.000
2peptides
spectra
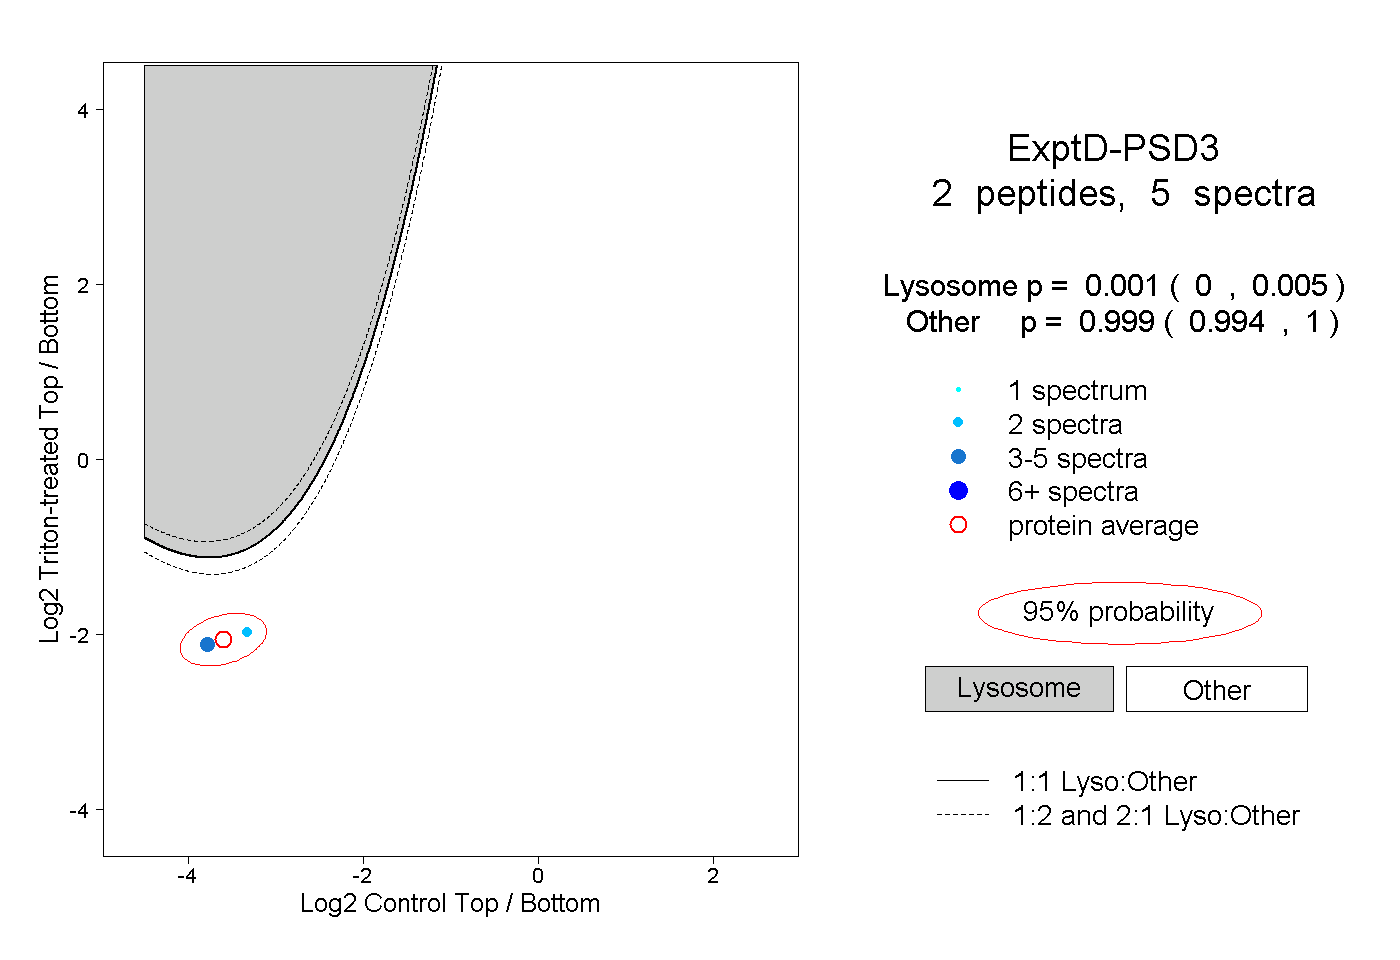
0.000 | 0.005
0.994 | 1.000