 8
8peptides
spectra
0.000 | 0.000
0.000 | 0.000
0.018 | 0.042
0.193 | 0.229
0.000 | 0.000
0.648 | 0.684
0.053 | 0.098
0.000 | 0.022
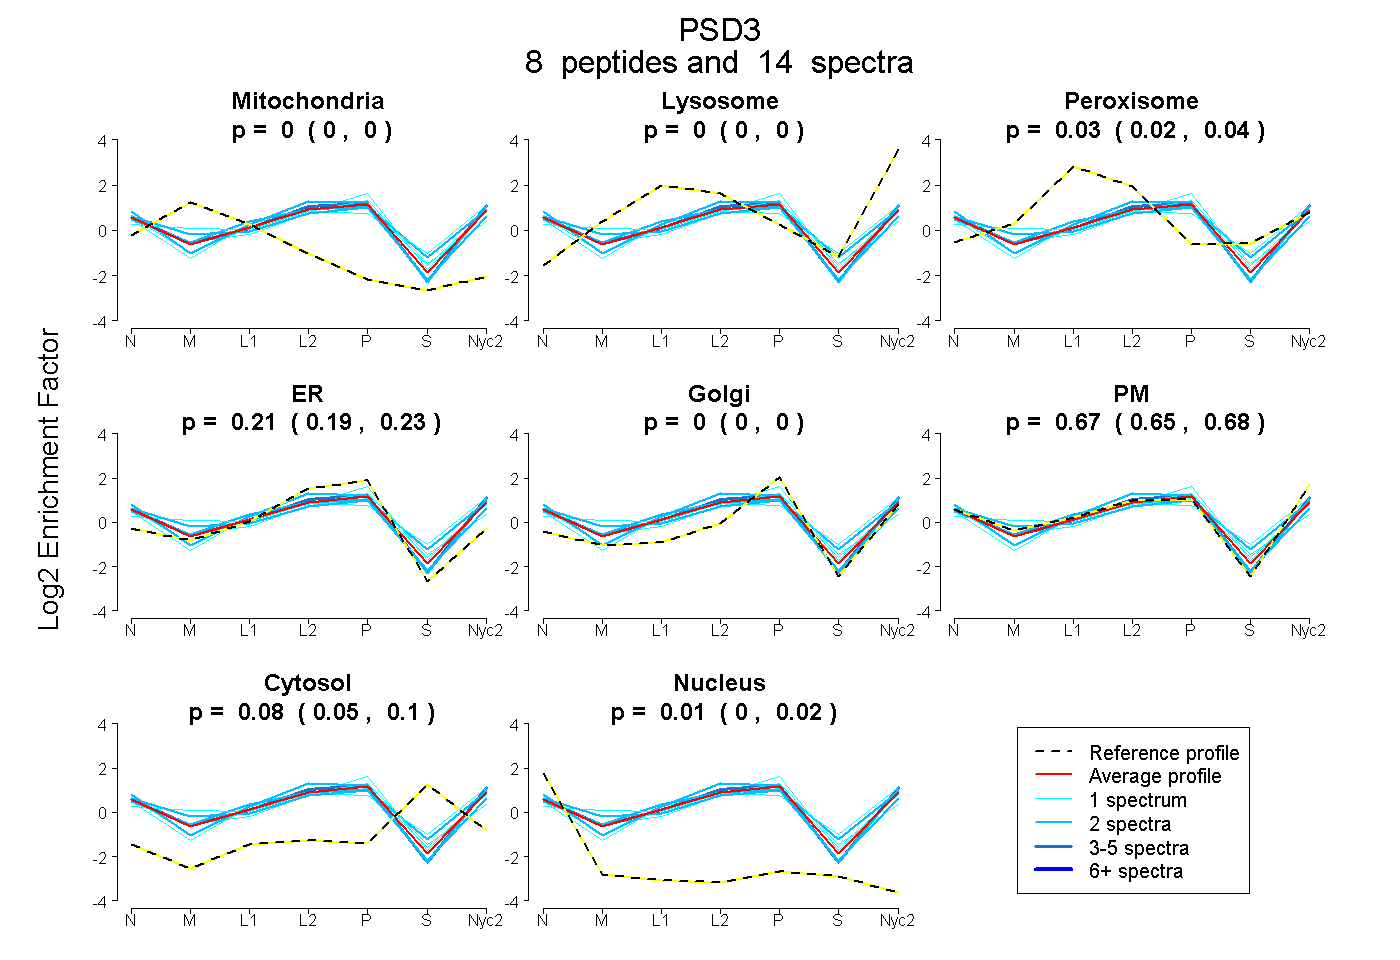
| Plot | Mito | Lyso | Perox | ER | Golgi | PM | Cytosol | Nucleus | |||||
| Expt A |
8 peptides |
14 spectra |
|
0.000 0.000 | 0.000 |
0.000 0.000 | 0.000 |
0.031 0.018 | 0.042 |
0.212 0.193 | 0.229 |
0.000 0.000 | 0.000 |
0.668 0.648 | 0.684 |
0.078 0.053 | 0.098 |
0.011 0.000 | 0.022 |
| 2 spectra, TASHKPQR | 0.000 | 0.000 | 0.013 | 0.250 | 0.000 | 0.713 | 0.000 | 0.024 | ||
| 1 spectrum, LVAEEYLK | 0.000 | 0.000 | 0.029 | 0.374 | 0.000 | 0.446 | 0.148 | 0.004 | ||
| 2 spectra, LSQEEQLK | 0.000 | 0.000 | 0.142 | 0.127 | 0.000 | 0.603 | 0.128 | 0.000 | ||
| 1 spectrum, LYHLDR | 0.000 | 0.000 | 0.174 | 0.000 | 0.036 | 0.642 | 0.147 | 0.000 | ||
| 1 spectrum, DHYLDFEK | 0.000 | 0.000 | 0.000 | 0.159 | 0.000 | 0.694 | 0.137 | 0.010 | ||
| 4 spectra, LEWAADDEEK | 0.000 | 0.000 | 0.000 | 0.207 | 0.000 | 0.756 | 0.021 | 0.016 | ||
| 1 spectrum, IGSTTNPFLDIPHDPNAAVYK | 0.000 | 0.000 | 0.014 | 0.263 | 0.100 | 0.533 | 0.089 | 0.000 | ||
| 2 spectra, SLSDEDLK | 0.089 | 0.000 | 0.000 | 0.217 | 0.000 | 0.649 | 0.015 | 0.030 |
| Plot | Mito | Lyso or Perox | ER | Golgi | PM | Cytosol | Nucleus | ||||||
| Expt B |
1 peptide |
2 spectra |
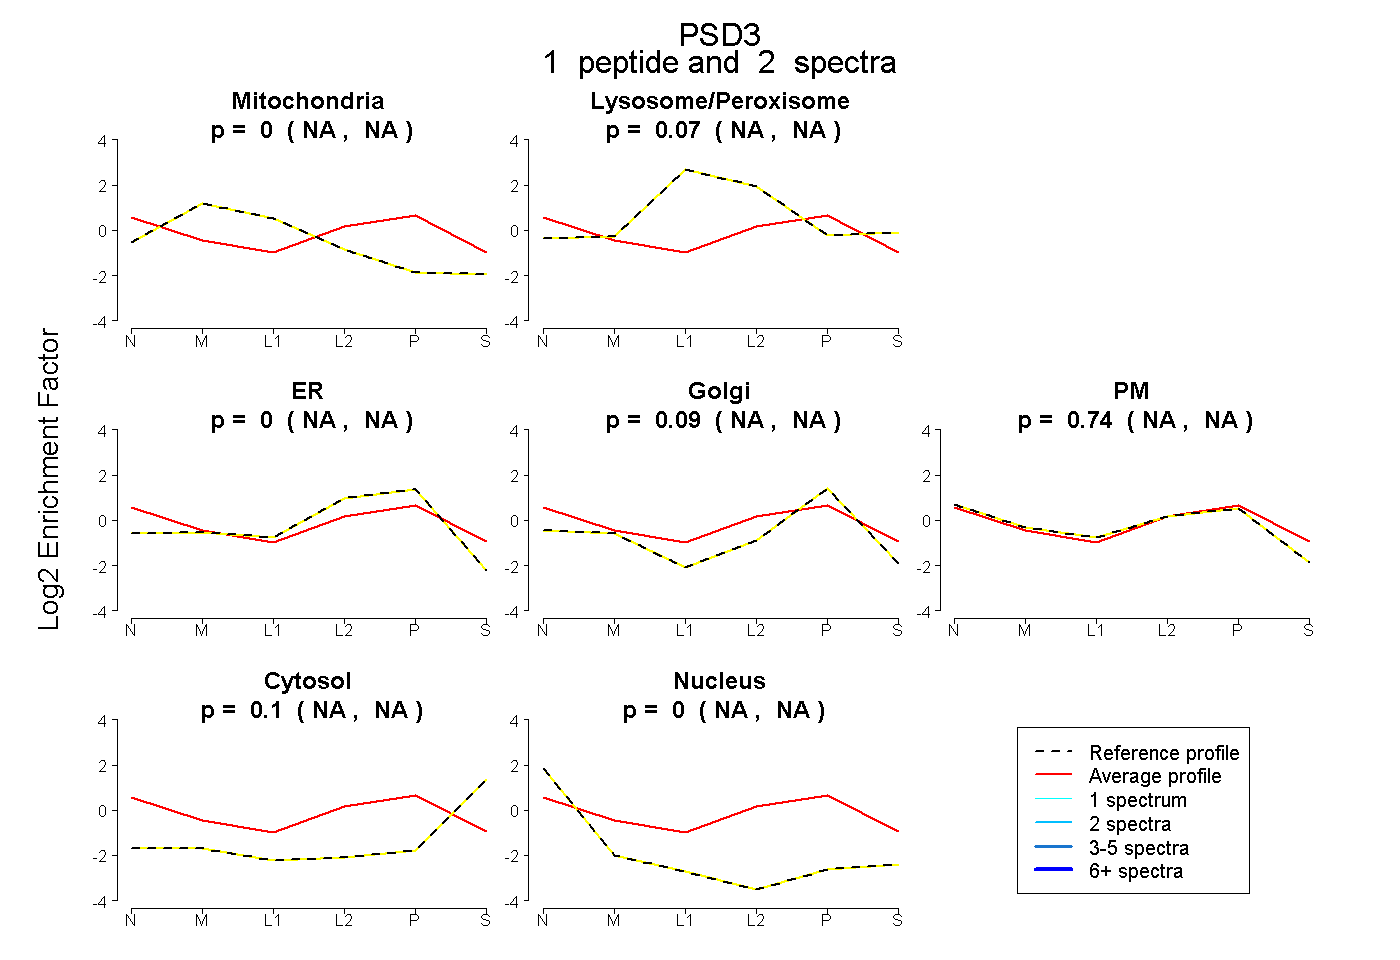 |
0.000 NA | NA |
0.074 NA | NA |
0.000 NA | NA |
0.087 NA | NA |
0.742 NA | NA |
0.098 NA | NA |
0.000 NA | NA |
|||
| Plot | Lyso | Other | |||||||||||
| Expt C |
8 peptides |
18 spectra |
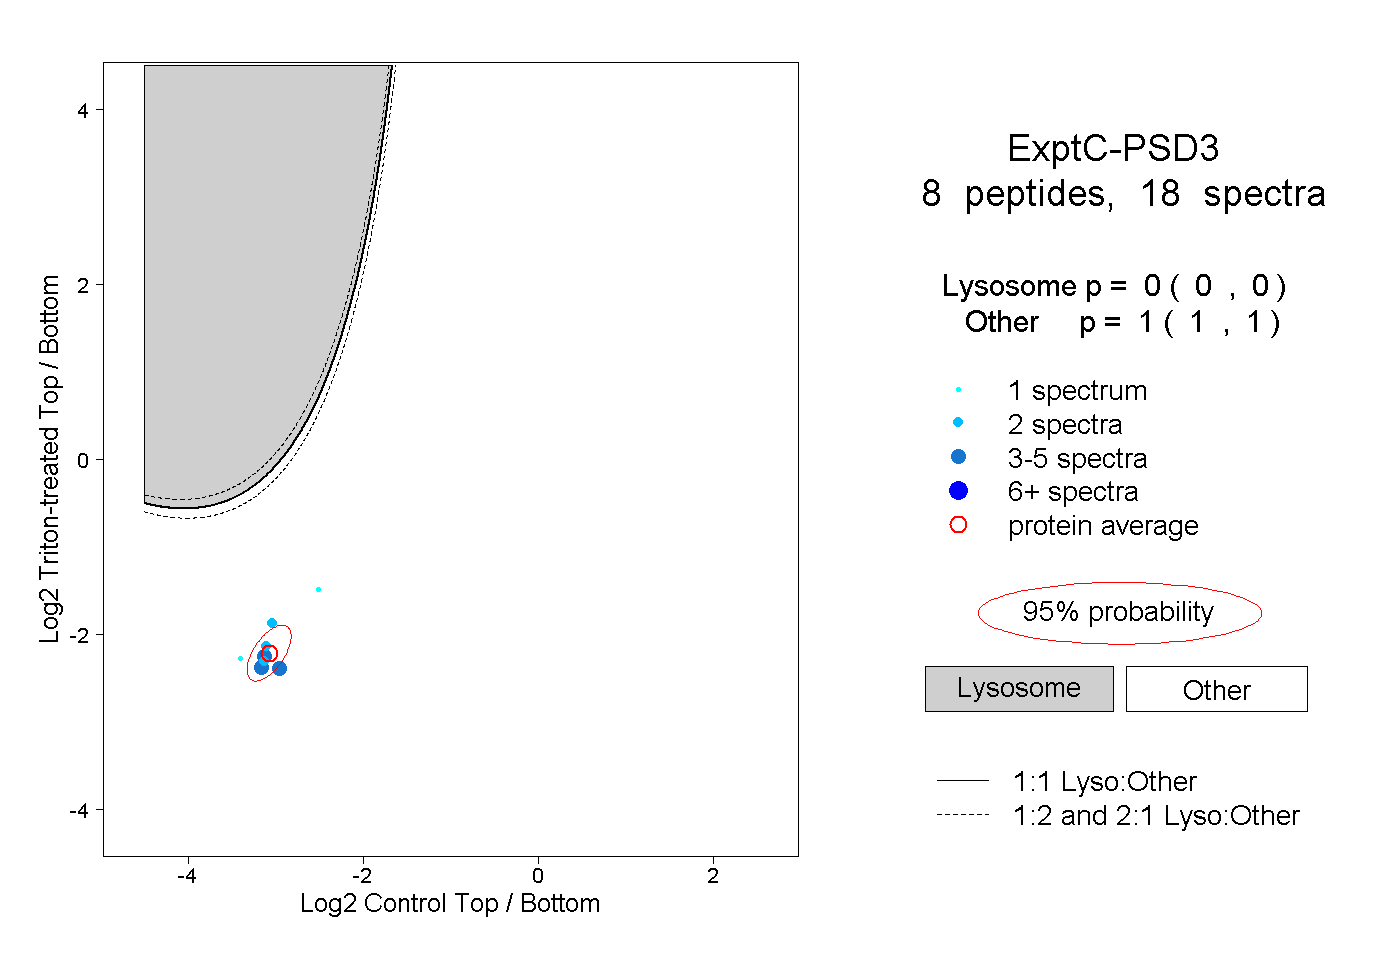 |
0.000 0.000 | 0.000 |
1.000 1.000 | 1.000 |
||||||||
| Plot | Lyso | Other | |||||||||||
| Expt D |
2 peptides |
5 spectra |
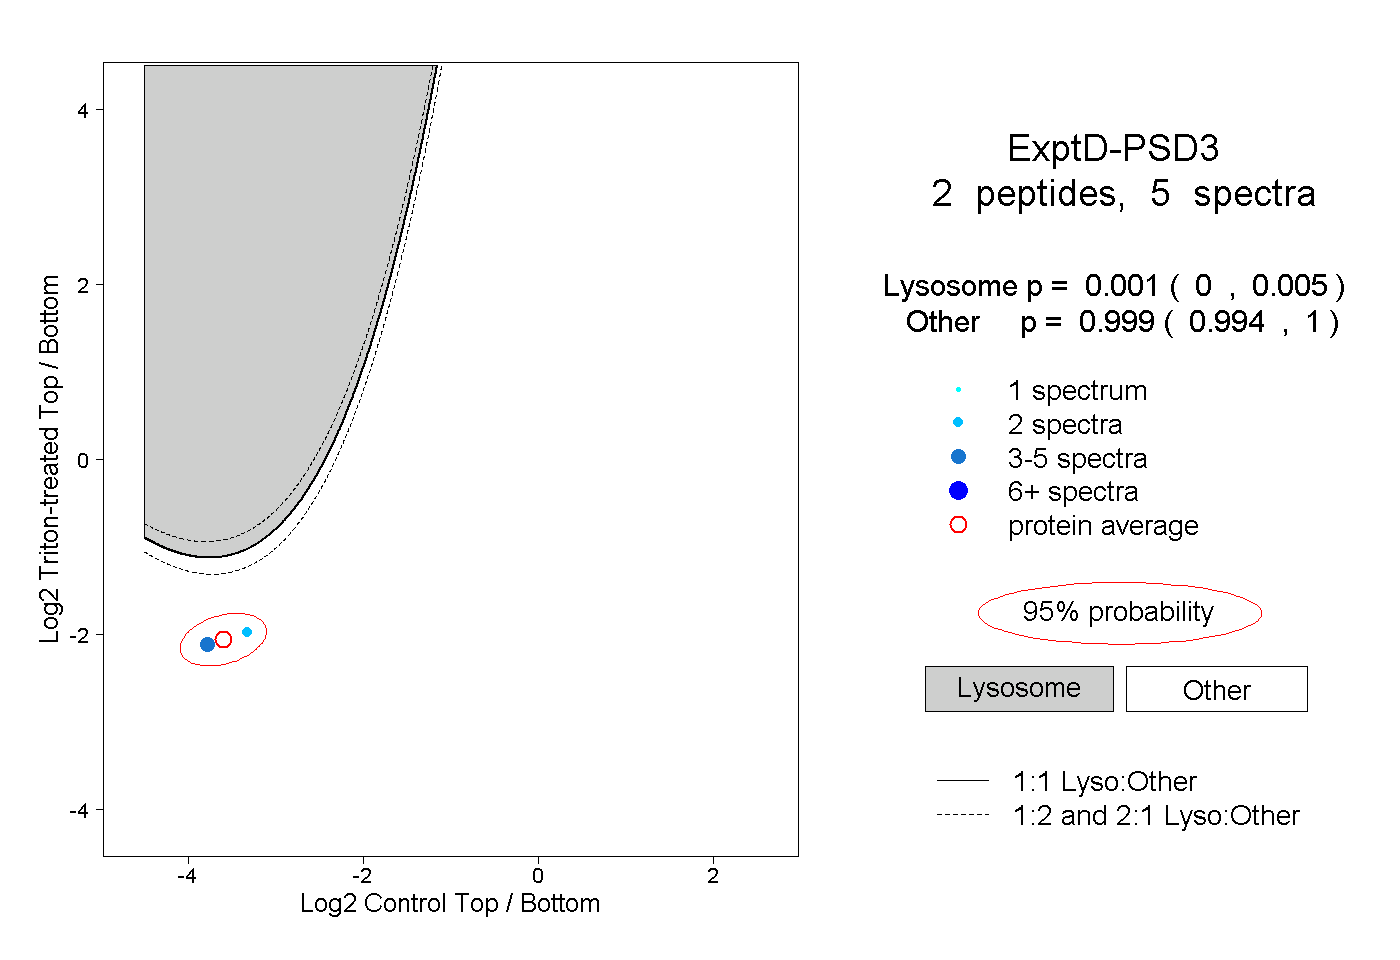 |
0.001 0.000 | 0.005 |
0.999 0.994 | 1.000 |