 5
5peptides
spectra
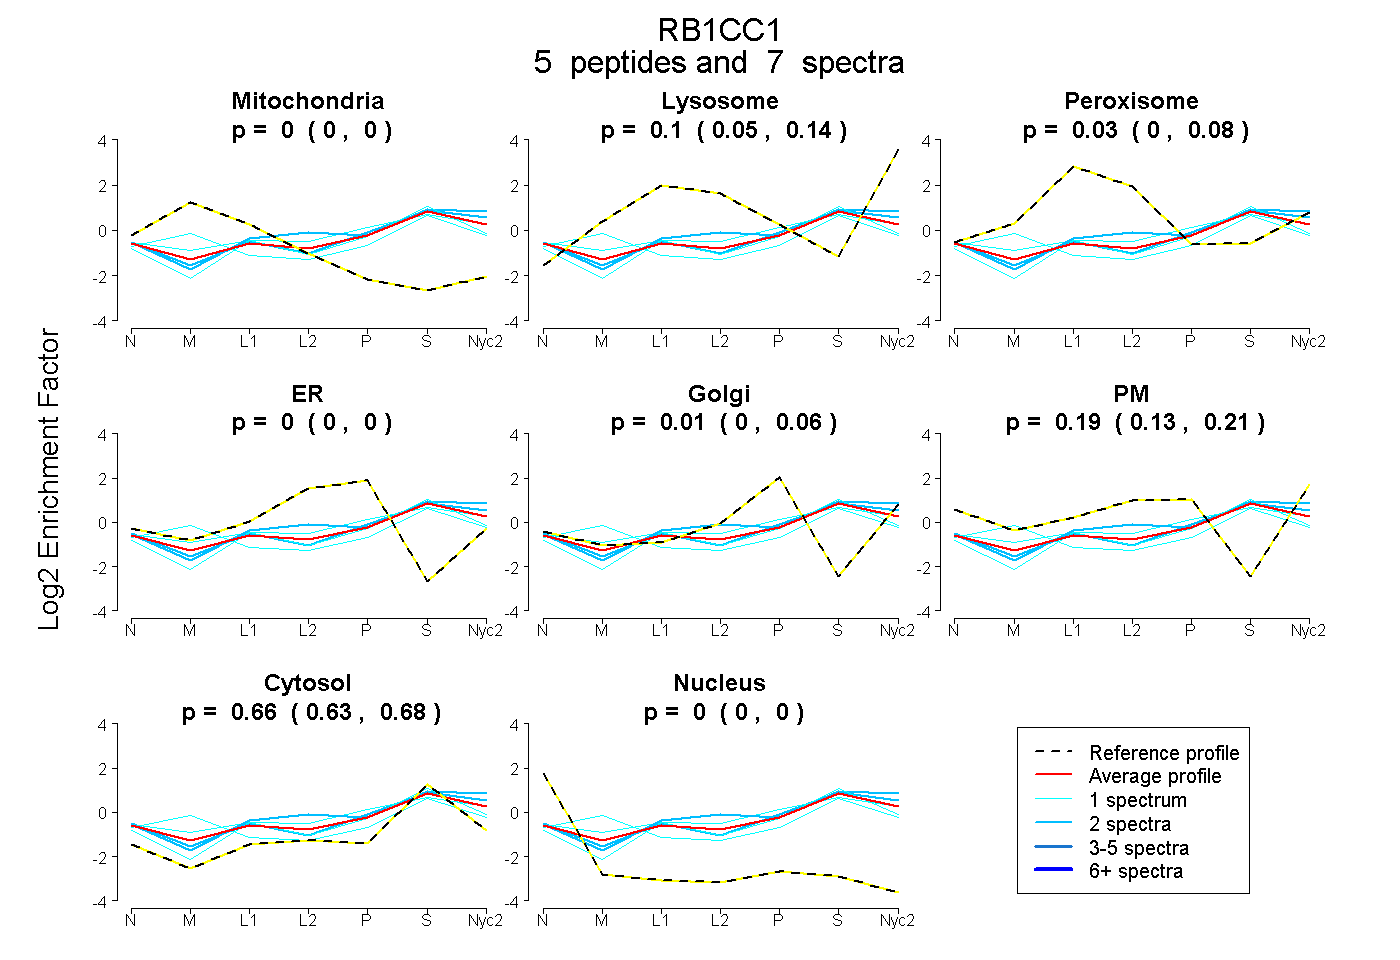
0.000 | 0.000
0.054 | 0.135
0.000 | 0.082
0.000 | 0.000
0.000 | 0.063
0.126 | 0.213
0.633 | 0.679
0.000 | 0.000
14peptides
spectra
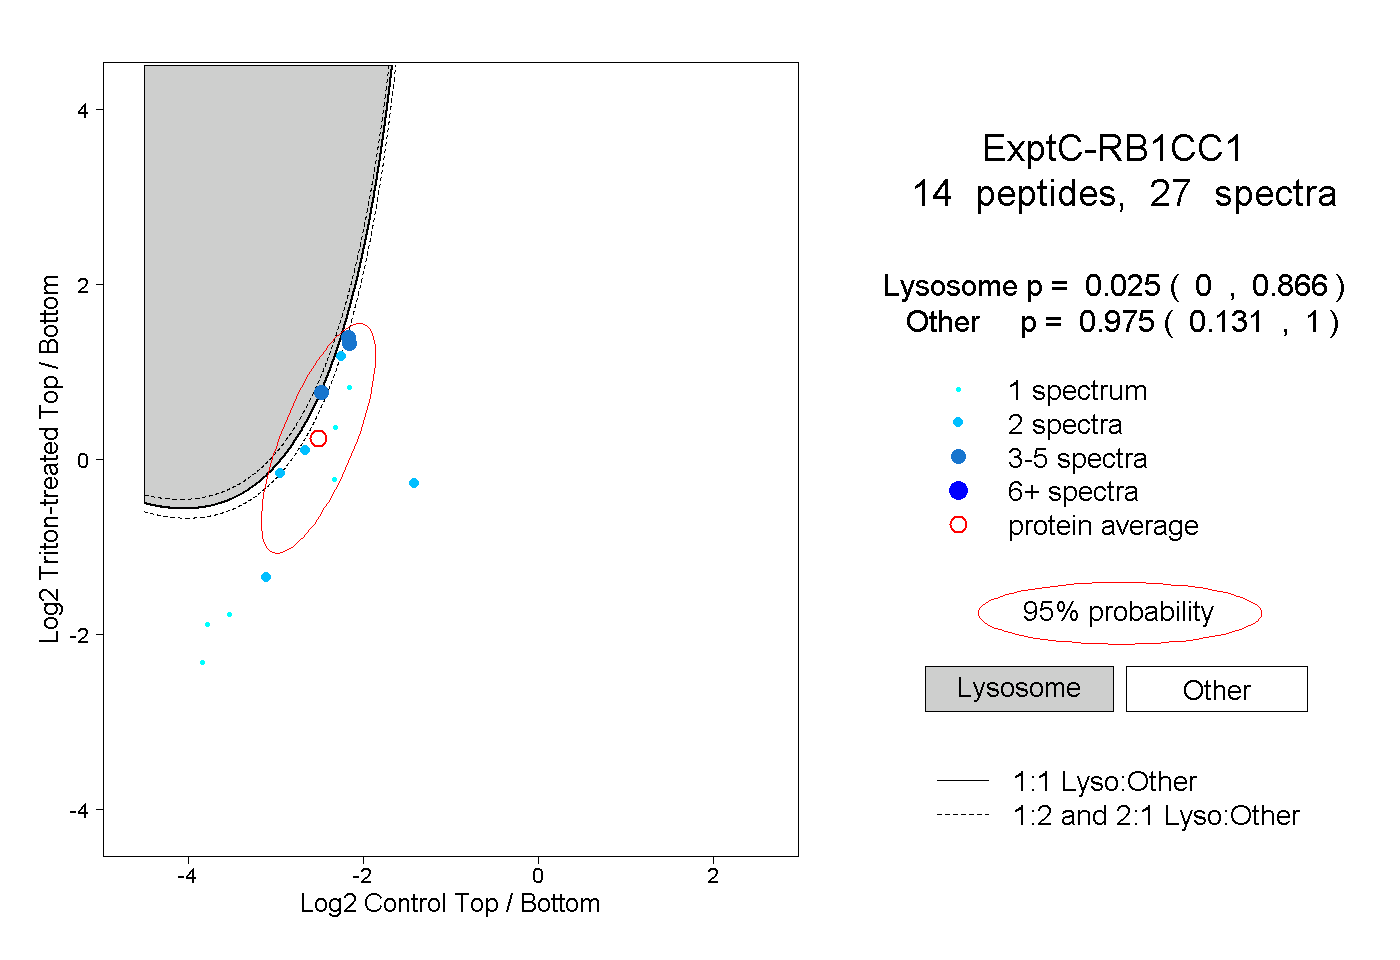
0.000 | 0.866
0.131 | 1.000
1peptide
spectrum
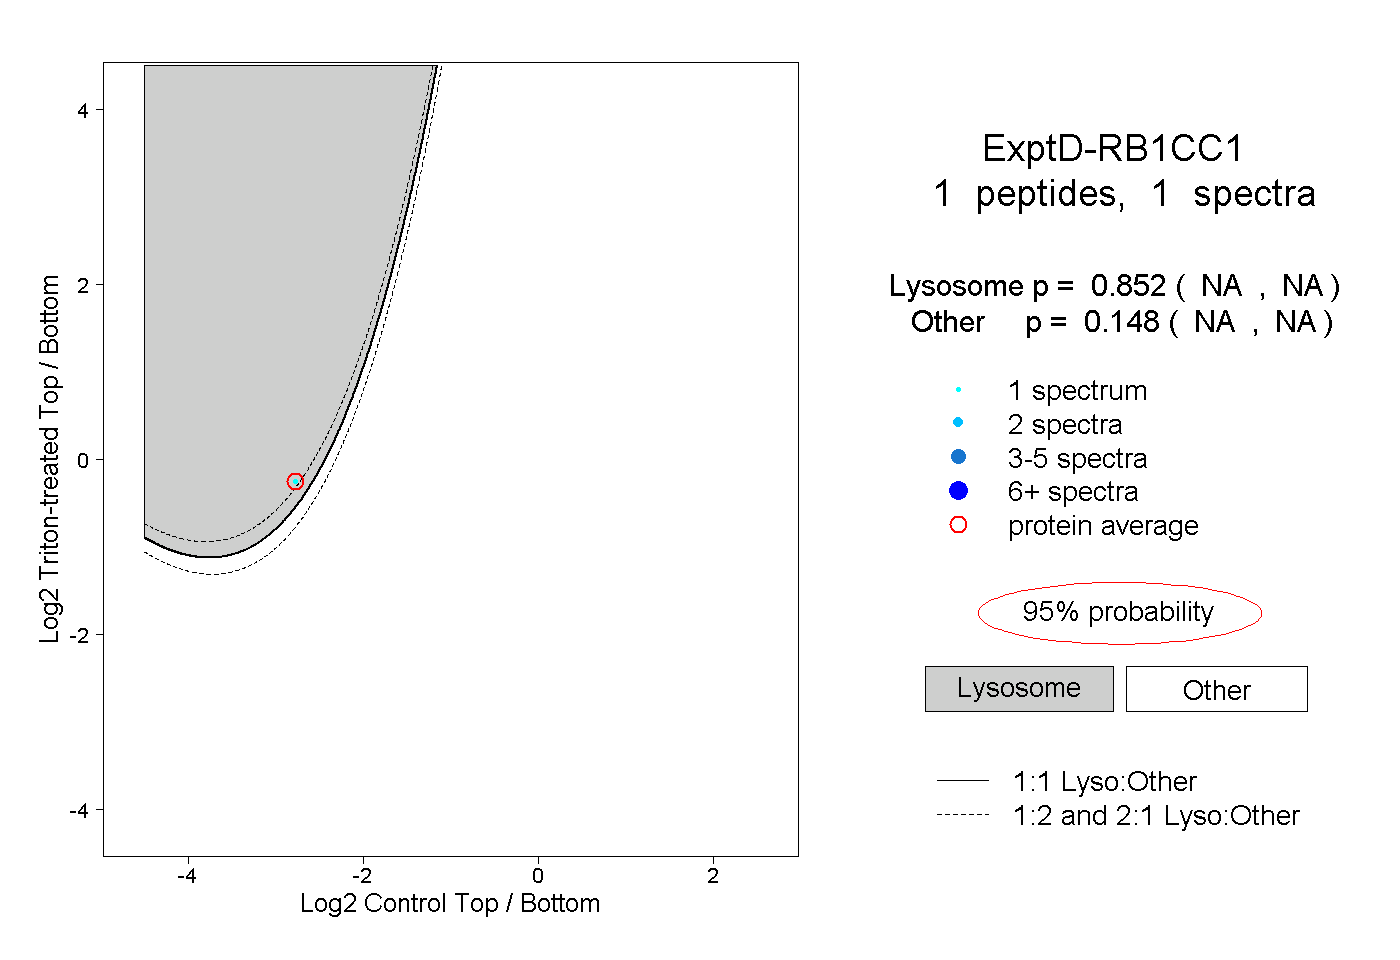
NA | NA
NA | NA