 5
5peptides
spectra
0.000 | 0.000
0.054 | 0.135
0.000 | 0.082
0.000 | 0.000
0.000 | 0.063
0.126 | 0.213
0.633 | 0.679
0.000 | 0.000
14peptides
spectra
0.000 | 0.866
0.131 | 1.000
| Plot | Mito | Lyso | Perox | ER | Golgi | PM | Cytosol | Nucleus | |||||
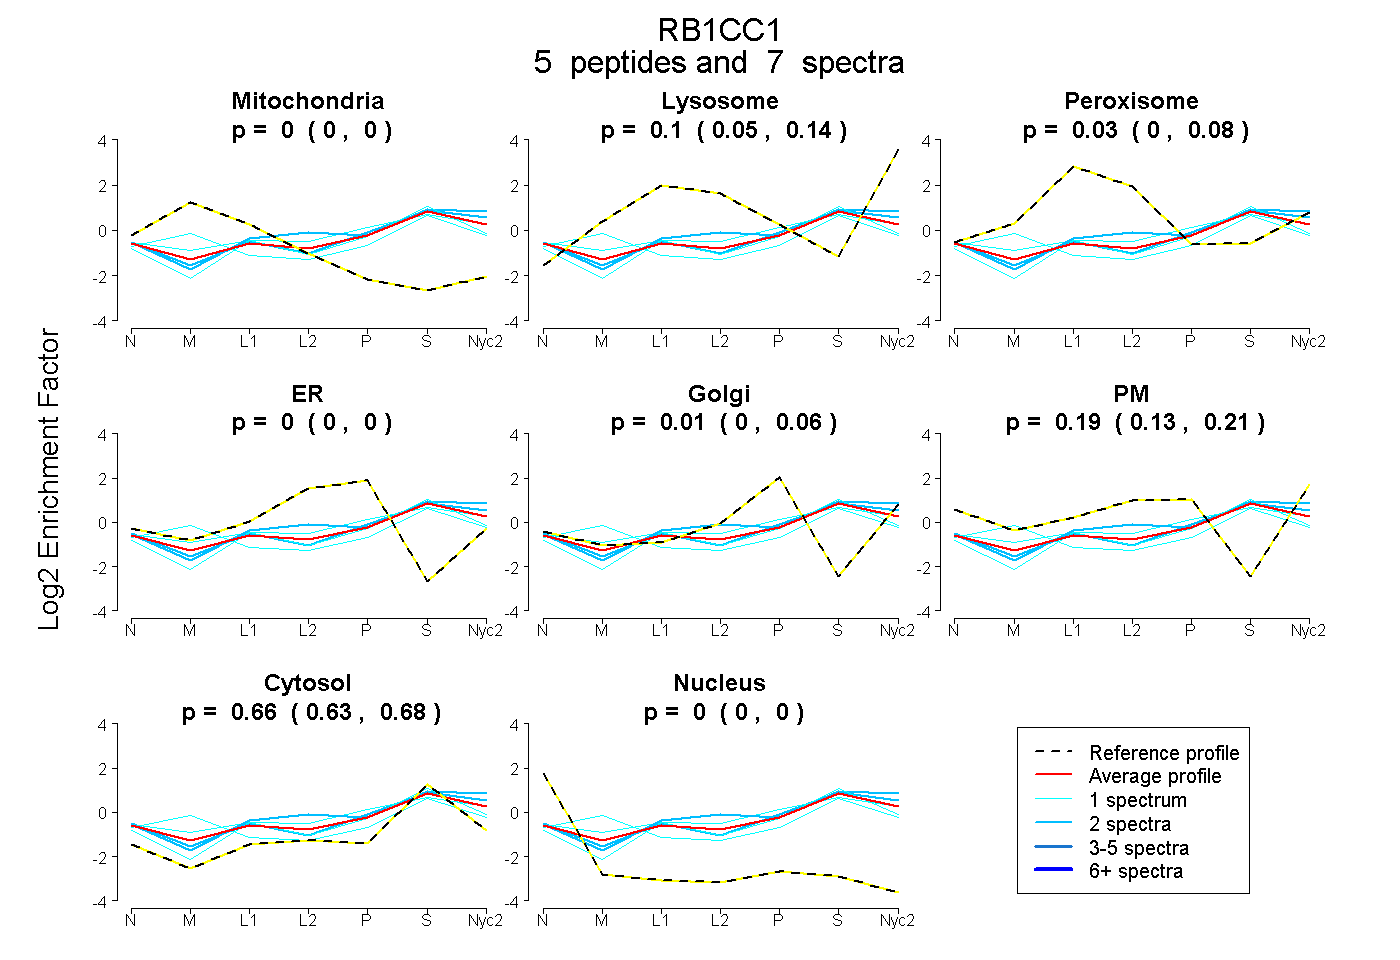
| Expt A |
5 peptides |
7 spectra |
|
0.000 0.000 | 0.000 |
0.101 0.054 | 0.135 |
0.033 0.000 | 0.082 |
0.000 0.000 | 0.000 |
0.014 0.000 | 0.063 |
0.191 0.126 | 0.213 |
0.661 0.633 | 0.679 |
0.000 0.000 | 0.000 |
||
| Plot | Lyso | Other | |||||||||||
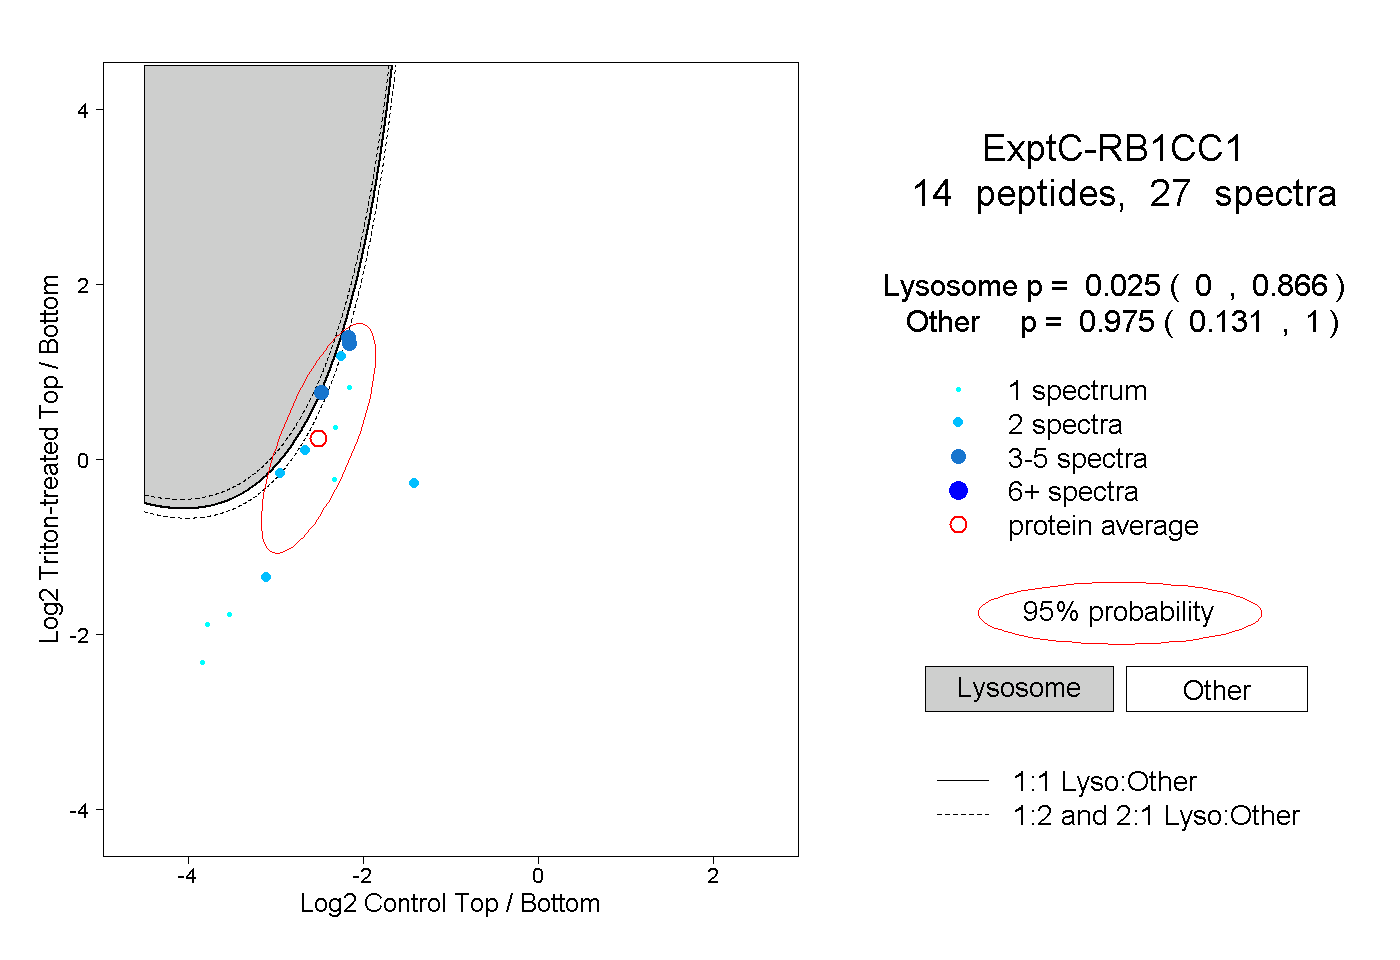
| Expt C |
14 peptides |
27 spectra |
|
0.025 0.000 | 0.866 |
0.975 0.131 | 1.000 |
| 1 spectrum, EQQLQELK | 0.003 | 0.997 | ||||||||
| 2 spectra, IPLLECLTR | 0.000 | 1.000 | ||||||||
| 1 spectrum, ILLEESR | 0.000 | 1.000 | ||||||||
| 2 spectra, EDSSSLVAELQEK | 0.000 | 1.000 | ||||||||
| 1 spectrum, EYCQAK | 0.003 | 0.997 | ||||||||
| 4 spectra, DSEENVNK | 0.076 | 0.924 | ||||||||
| 2 spectra, SPAFESAR | 0.067 | 0.933 | ||||||||
| 1 spectrum, VSTSQASPQSAASPR | 0.000 | 1.000 | ||||||||
| 4 spectra, HTEEFEK | 0.459 | 0.541 | ||||||||
| 1 spectrum, MNDVAIVK | 0.000 | 1.000 | ||||||||
| 1 spectrum, VITDHK | 0.000 | 1.000 | ||||||||
| 2 spectra, HEEESNILK | 0.201 | 0.799 | ||||||||
| 3 spectra, EAETDEIK | 0.148 | 0.852 | ||||||||
| 2 spectra, SLLEQETENLR | 0.167 | 0.833 |
| Plot | Lyso | Other | |||||||||||
| Expt D |
1 peptide |
1 spectrum |
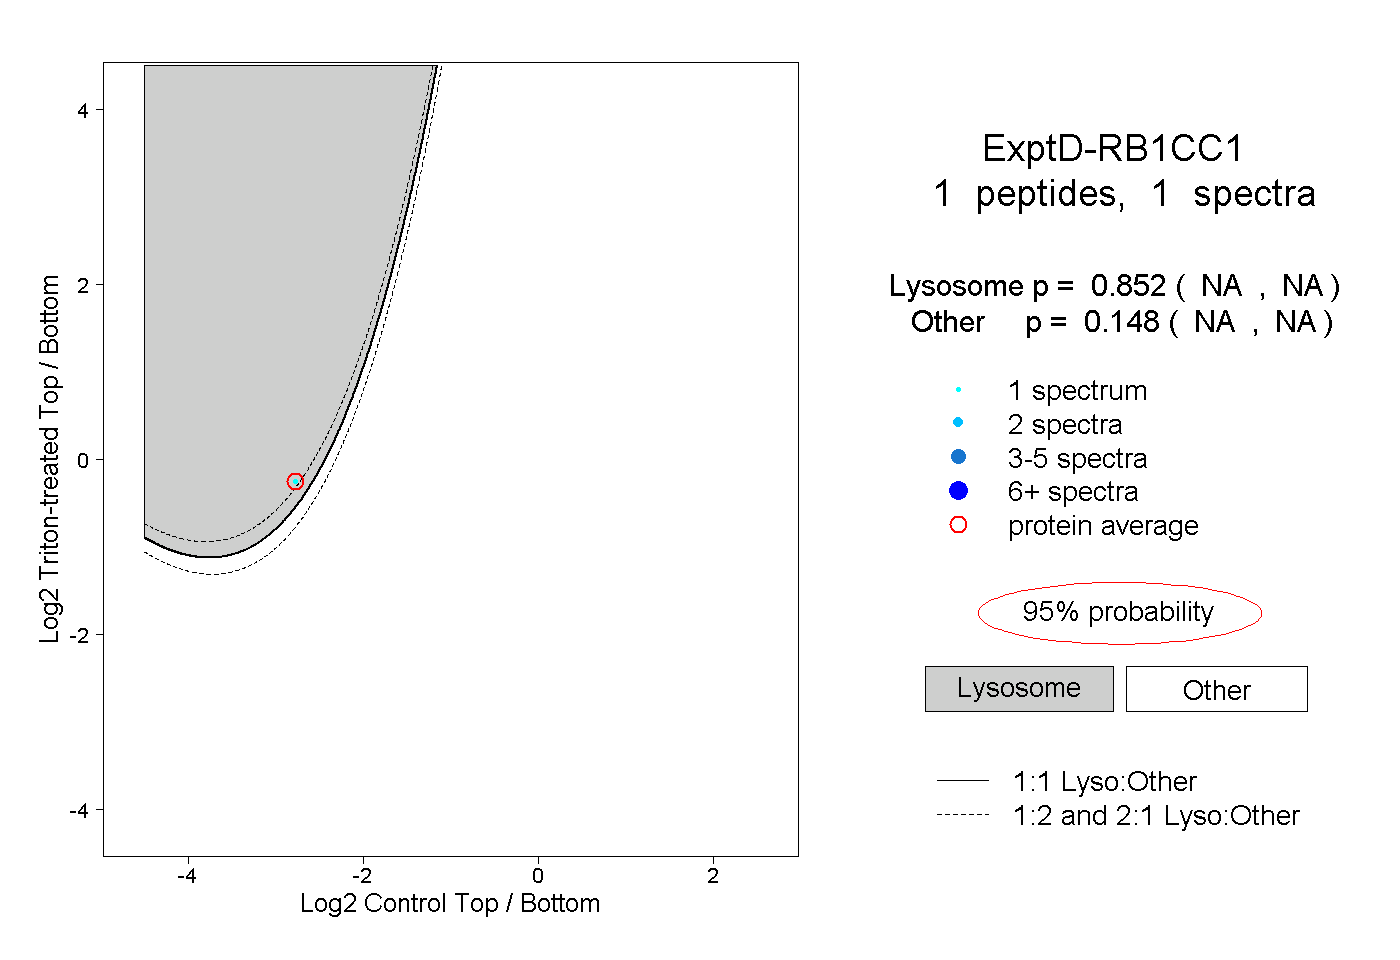 |
0.852 NA | NA |
0.148 NA | NA |