 11
11peptides
spectra
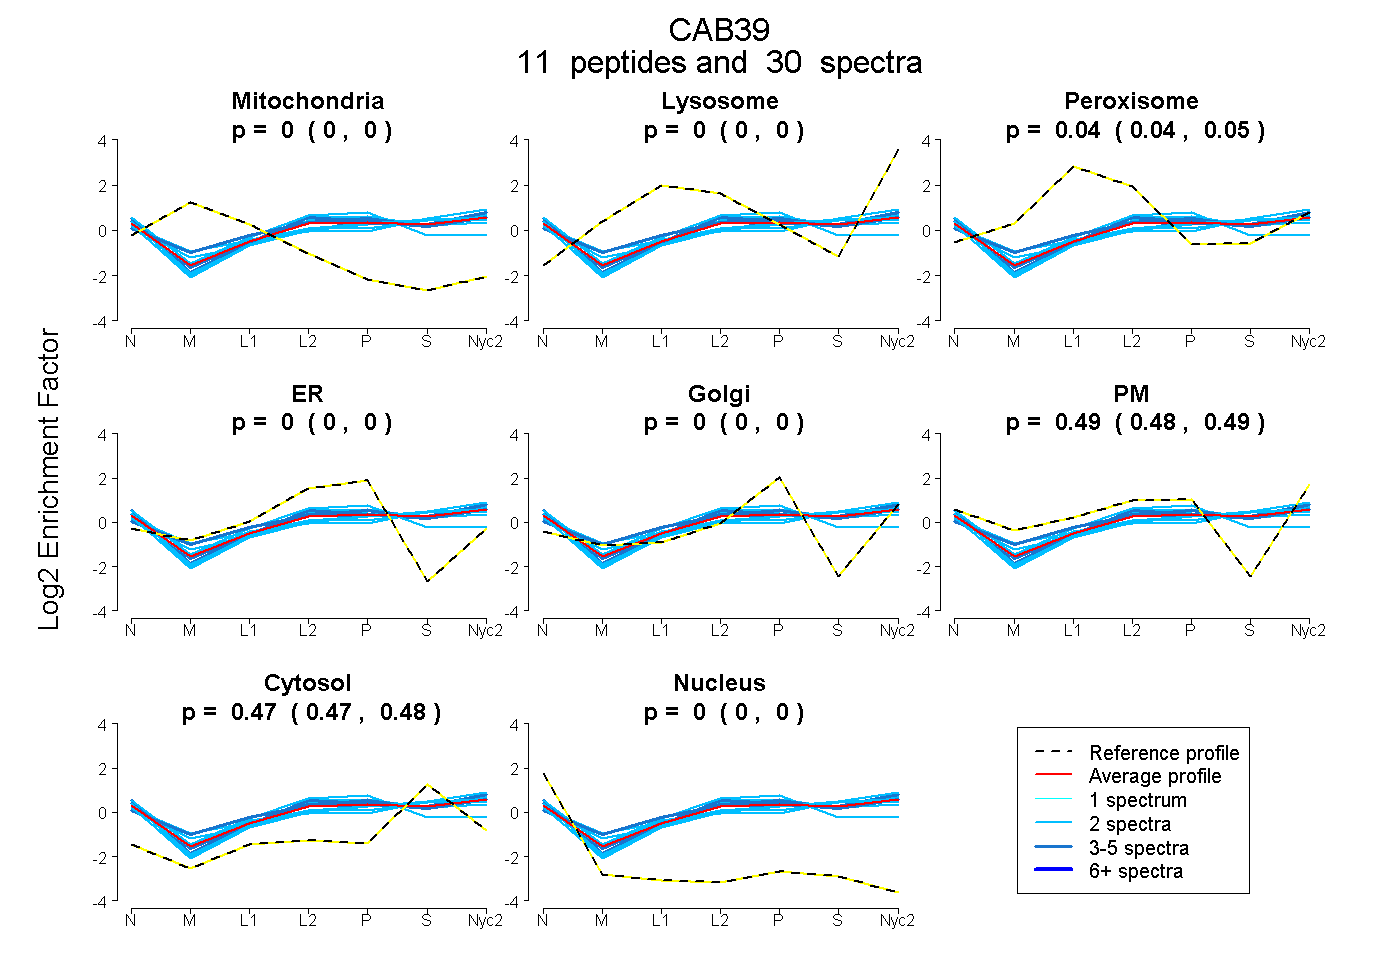
0.000 | 0.000
0.000 | 0.000
0.035 | 0.046
0.000 | 0.000
0.000 | 0.000
0.481 | 0.491
0.468 | 0.476
0.000 | 0.000
5peptides
spectra
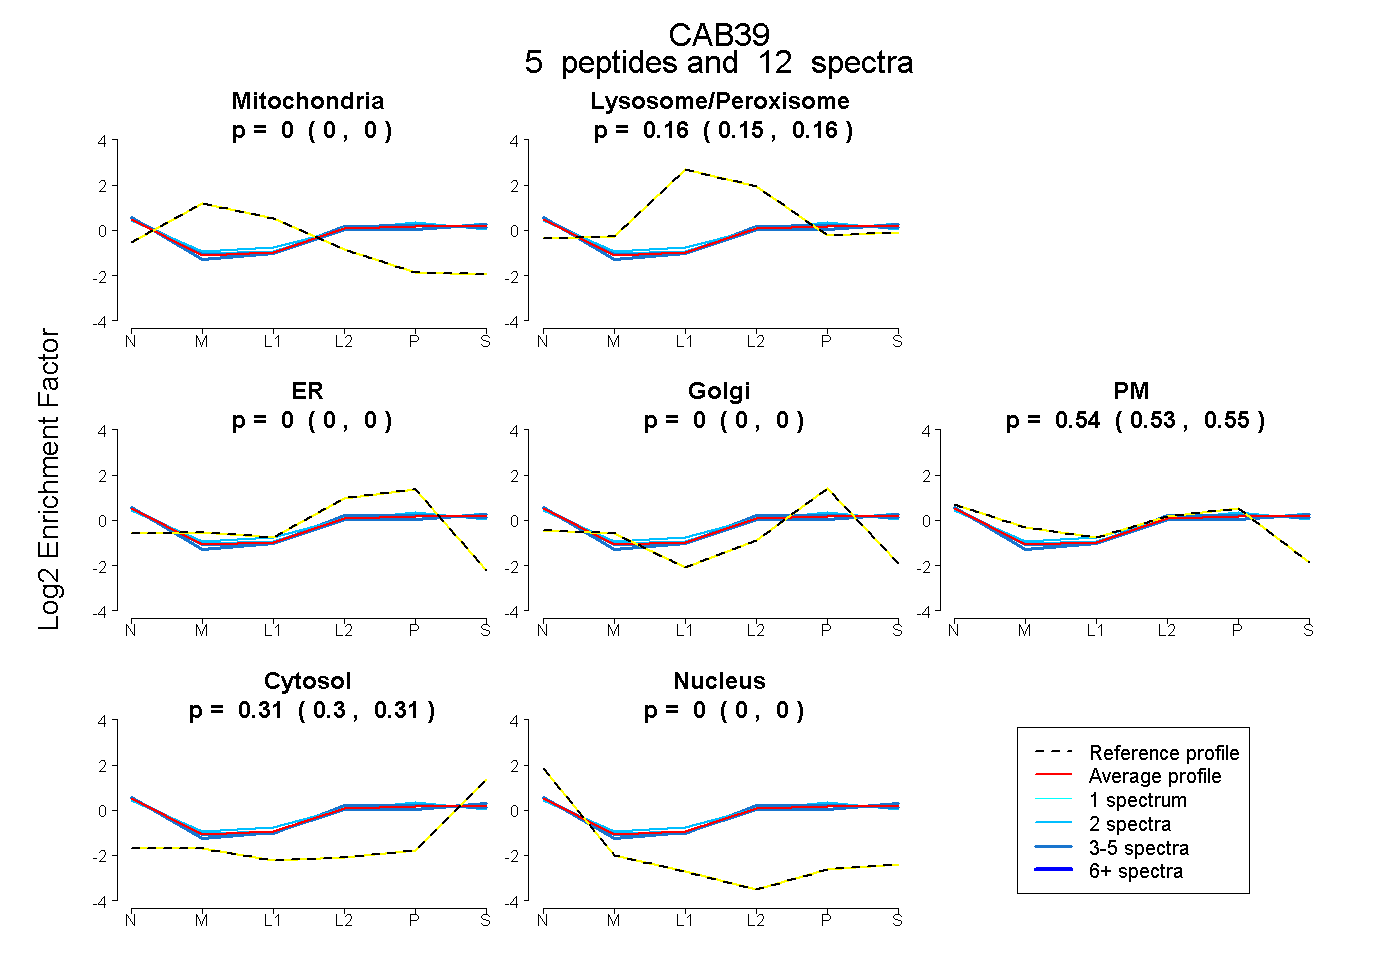
0.000 | 0.000
0.147 | 0.162
0.000 | 0.000
0.000 | 0.000
0.529 | 0.545
0.301 | 0.311
0.000 | 0.000
12peptides
spectra
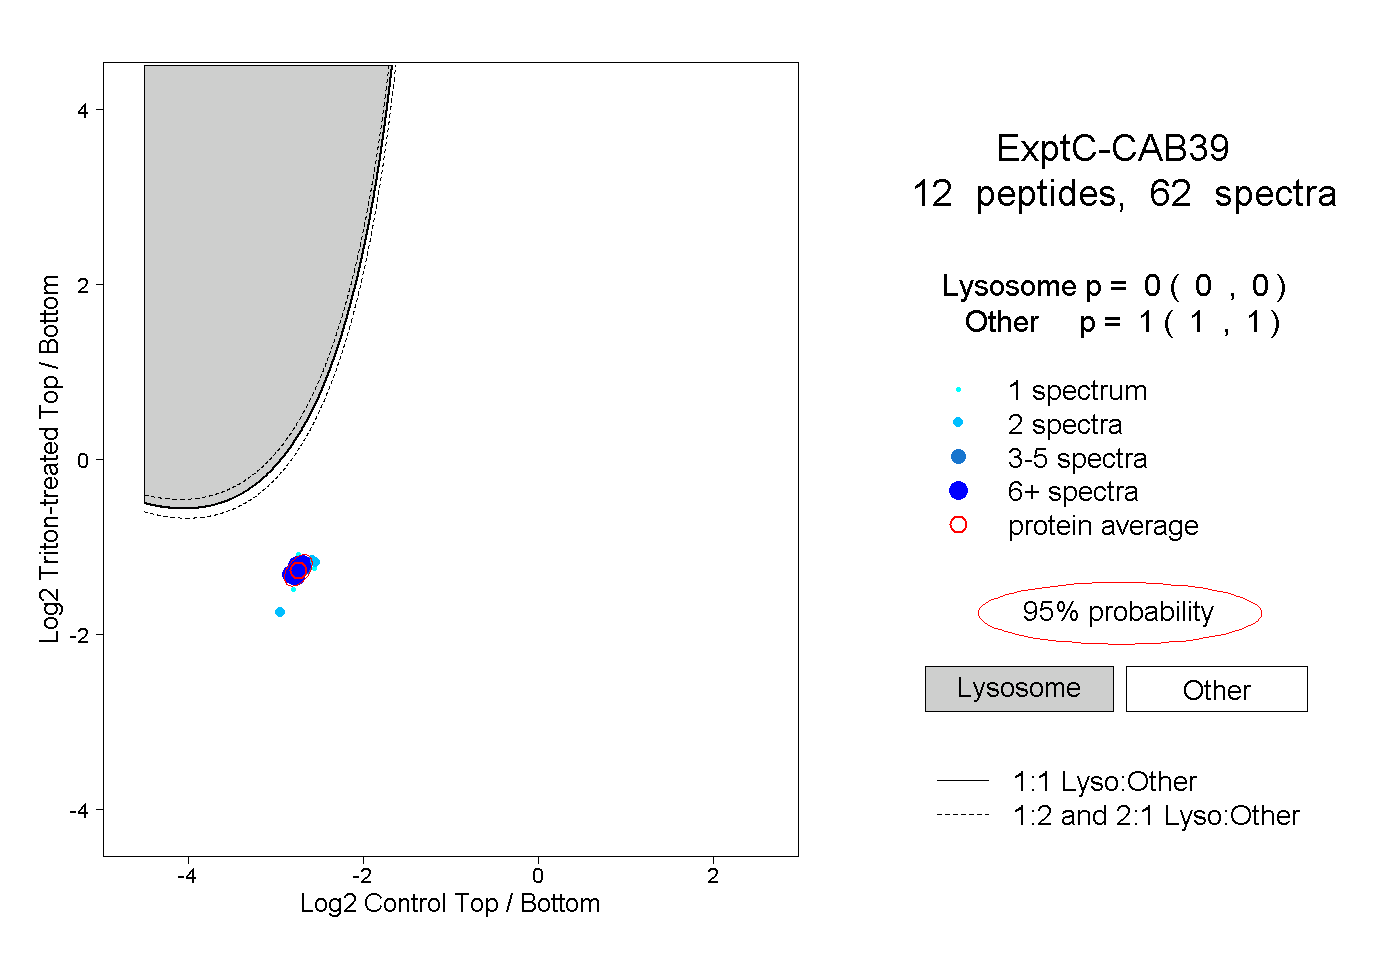
0.000 | 0.000
1.000 | 1.000
2peptides
spectra
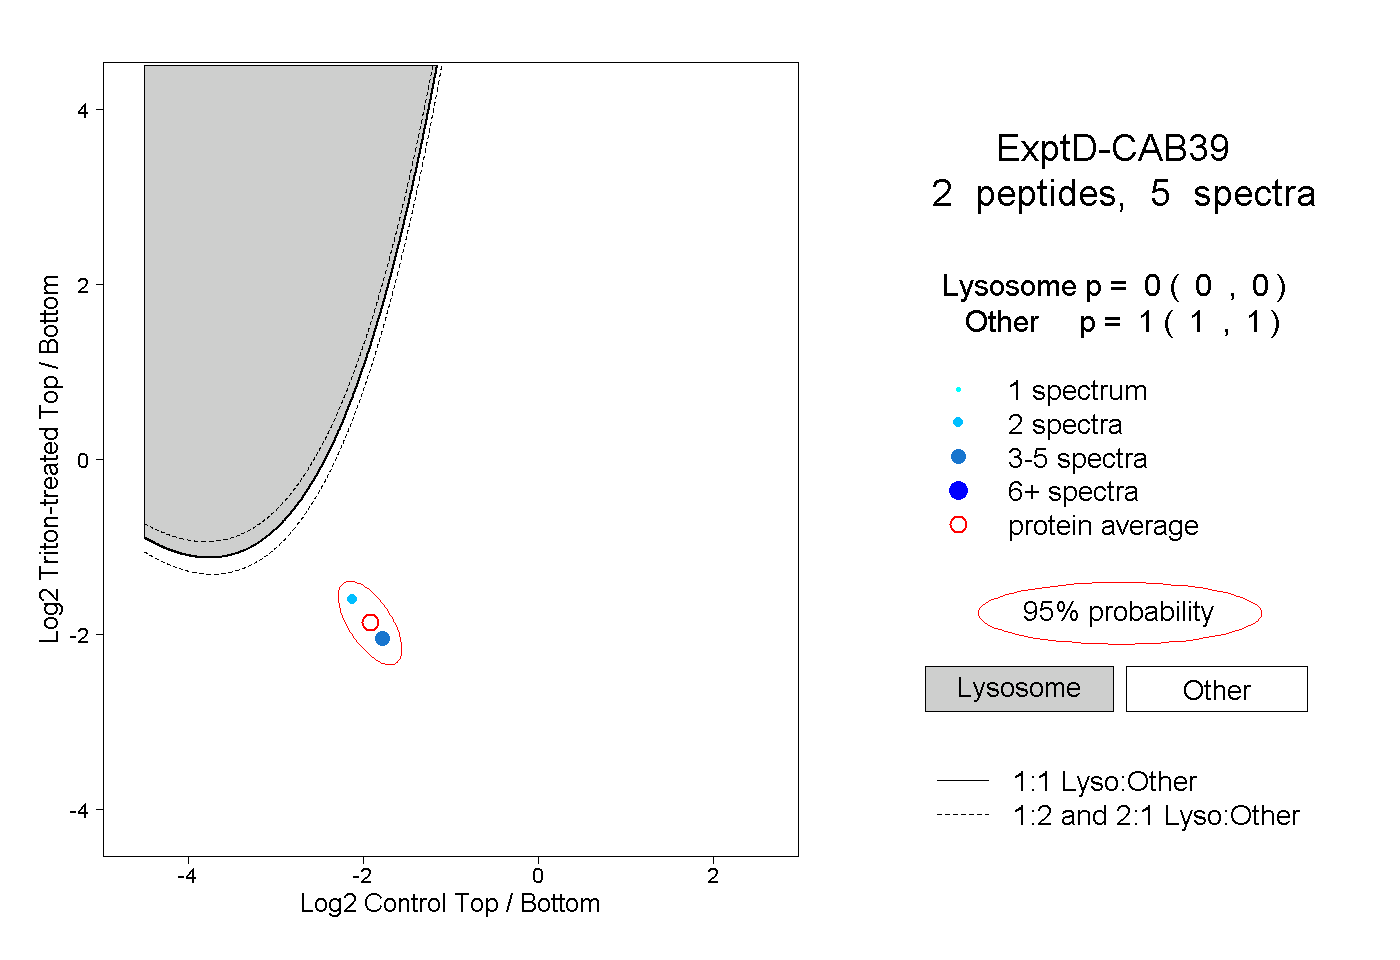
0.000 | 0.000
1.000 | 1.000