 11
11peptides
spectra
0.000 | 0.000
0.000 | 0.000
0.035 | 0.046
0.000 | 0.000
0.000 | 0.000
0.481 | 0.491
0.468 | 0.476
0.000 | 0.000
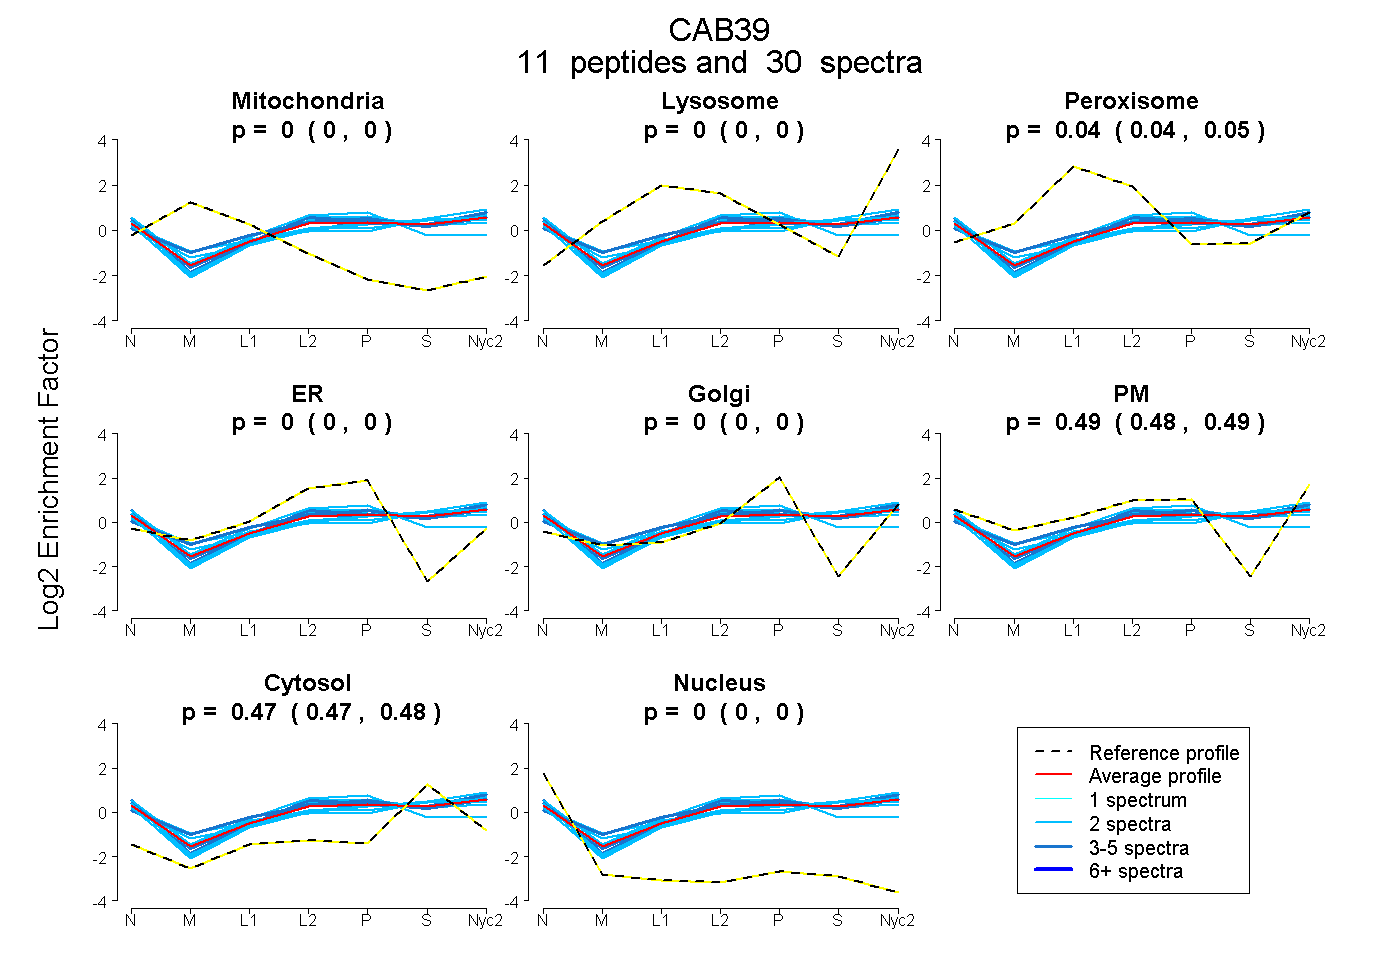
| Plot | Mito | Lyso | Perox | ER | Golgi | PM | Cytosol | Nucleus | |||||
| Expt A |
11 peptides |
30 spectra |
|
0.000 0.000 | 0.000 |
0.000 0.000 | 0.000 |
0.041 0.035 | 0.046 |
0.000 0.000 | 0.000 |
0.000 0.000 | 0.000 |
0.486 0.481 | 0.491 |
0.472 0.468 | 0.476 |
0.000 0.000 | 0.000 |
| 5 spectra, LMMNLLR | 0.000 | 0.000 | 0.133 | 0.000 | 0.021 | 0.440 | 0.405 | 0.000 | ||
| 2 spectra, LLSAEFLEQHYDR | 0.000 | 0.000 | 0.089 | 0.000 | 0.000 | 0.463 | 0.448 | 0.000 | ||
| 2 spectra, LLGELILDR | 0.000 | 0.000 | 0.055 | 0.324 | 0.000 | 0.246 | 0.376 | 0.000 | ||
| 2 spectra, TQPILDILLK | 0.000 | 0.000 | 0.000 | 0.000 | 0.000 | 0.454 | 0.546 | 0.000 | ||
| 2 spectra, HNFTIMTK | 0.000 | 0.000 | 0.048 | 0.112 | 0.000 | 0.404 | 0.437 | 0.000 | ||
| 2 spectra, HEPLAK | 0.000 | 0.000 | 0.000 | 0.000 | 0.000 | 0.447 | 0.553 | 0.000 | ||
| 2 spectra, FFSEYEK | 0.000 | 0.000 | 0.012 | 0.000 | 0.000 | 0.531 | 0.457 | 0.000 | ||
| 2 spectra, VFVANPNK | 0.000 | 0.000 | 0.001 | 0.000 | 0.000 | 0.453 | 0.545 | 0.000 | ||
| 5 spectra, LIEFLSK | 0.000 | 0.000 | 0.007 | 0.000 | 0.000 | 0.546 | 0.447 | 0.000 | ||
| 2 spectra, YVEMSTFDIASDAFATFK | 0.000 | 0.054 | 0.042 | 0.000 | 0.000 | 0.391 | 0.513 | 0.000 | ||
| 4 spectra, NIQFEAFHVFK | 0.000 | 0.000 | 0.033 | 0.000 | 0.000 | 0.506 | 0.461 | 0.000 |
| Plot | Mito | Lyso or Perox | ER | Golgi | PM | Cytosol | Nucleus | ||||||
| Expt B |
5 peptides |
12 spectra |
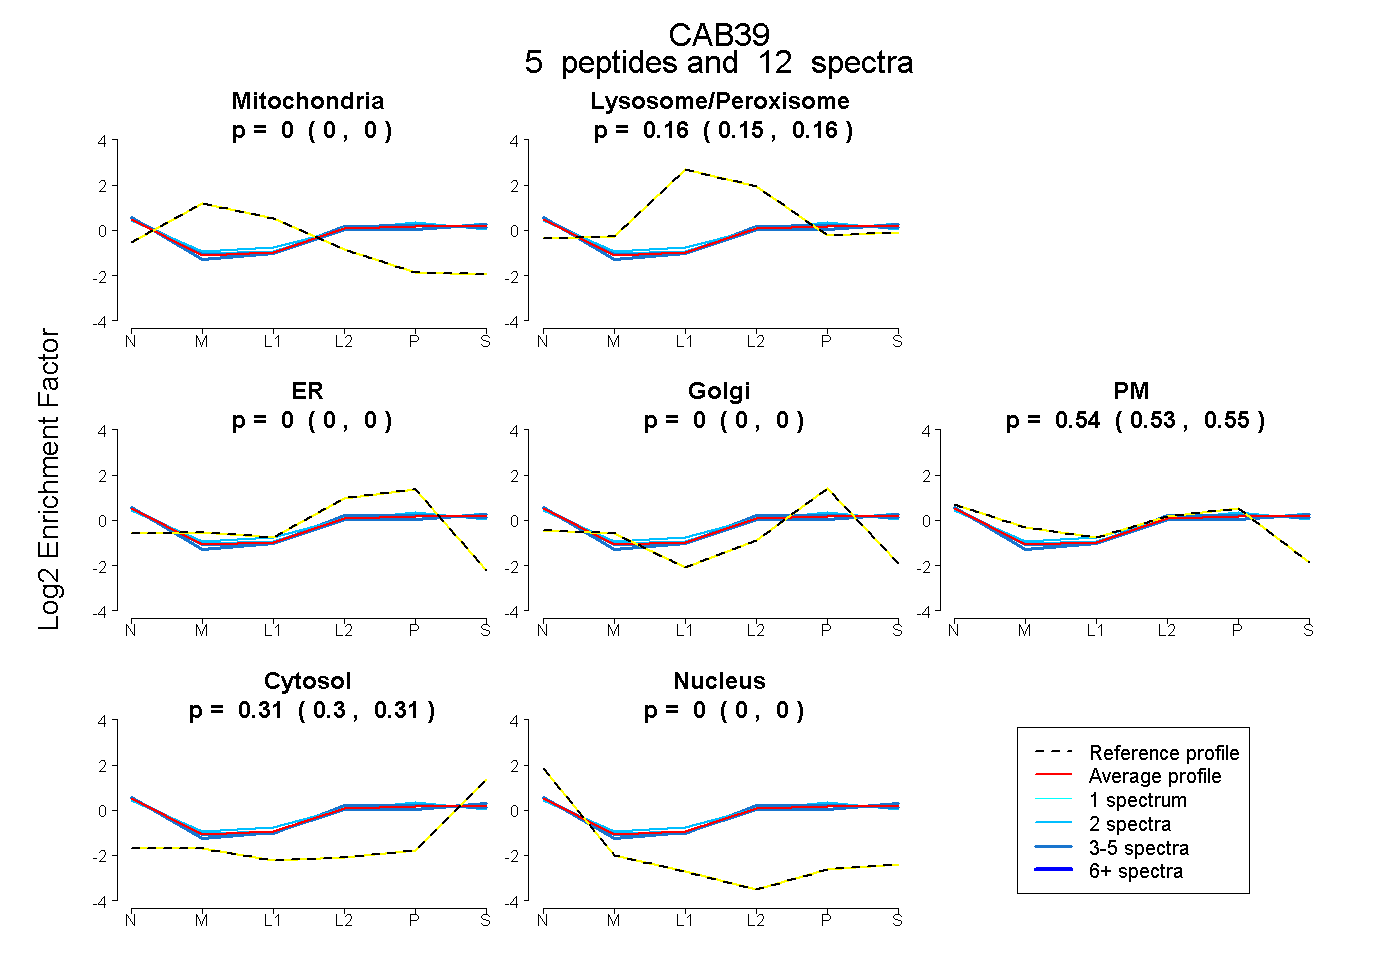 |
0.000 0.000 | 0.000 |
0.155 0.147 | 0.162 |
0.000 0.000 | 0.000 |
0.000 0.000 | 0.000 |
0.538 0.529 | 0.545 |
0.307 0.301 | 0.311 |
0.000 0.000 | 0.000 |
|||
| Plot | Lyso | Other | |||||||||||
| Expt C |
12 peptides |
62 spectra |
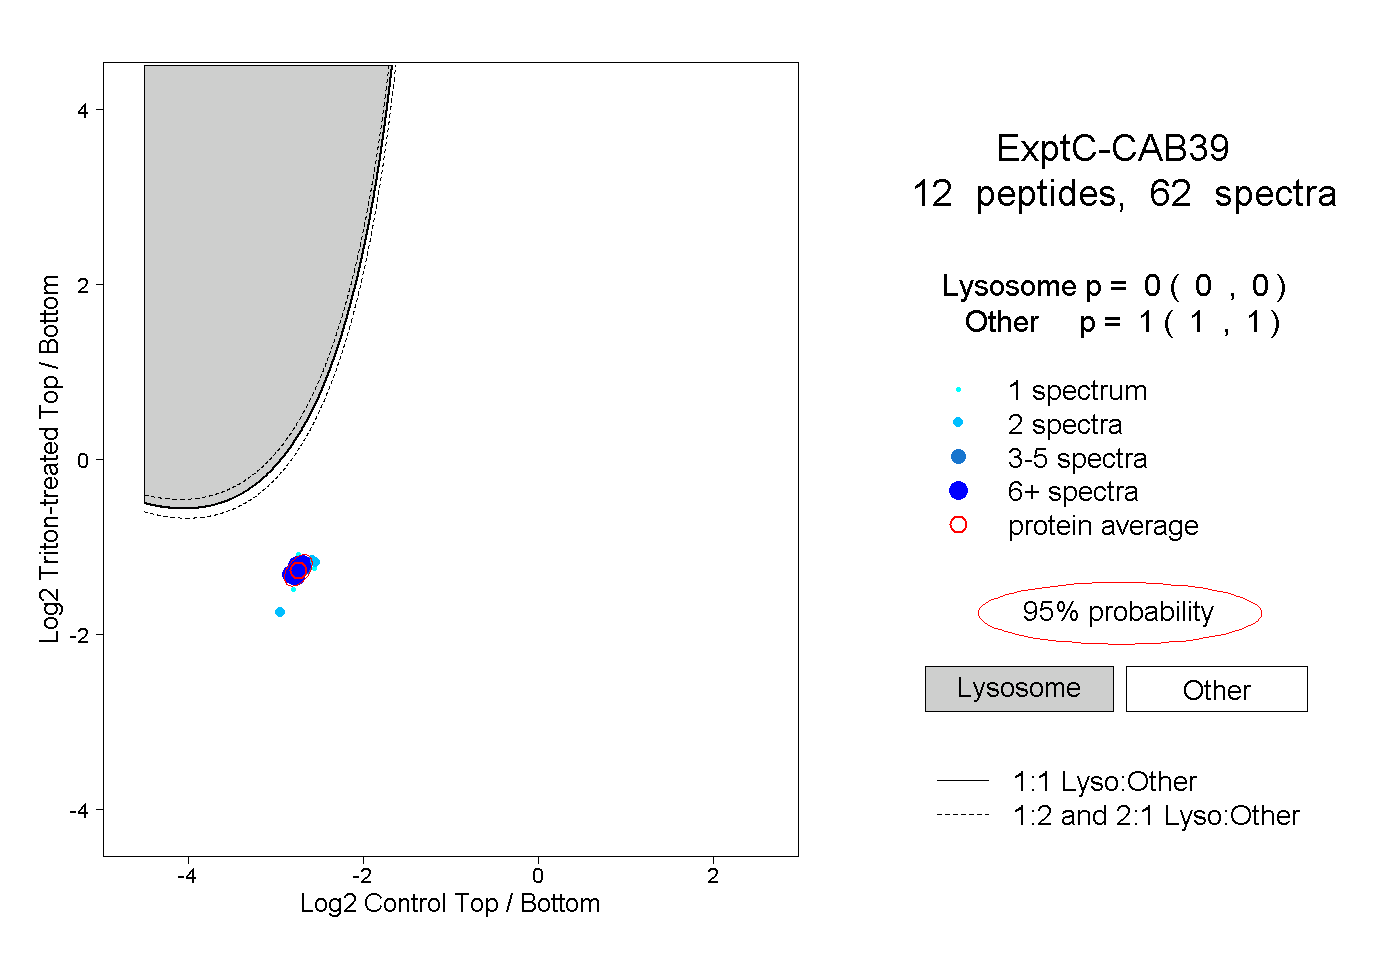 |
0.000 0.000 | 0.000 |
1.000 1.000 | 1.000 |
||||||||
| Plot | Lyso | Other | |||||||||||
| Expt D |
2 peptides |
5 spectra |
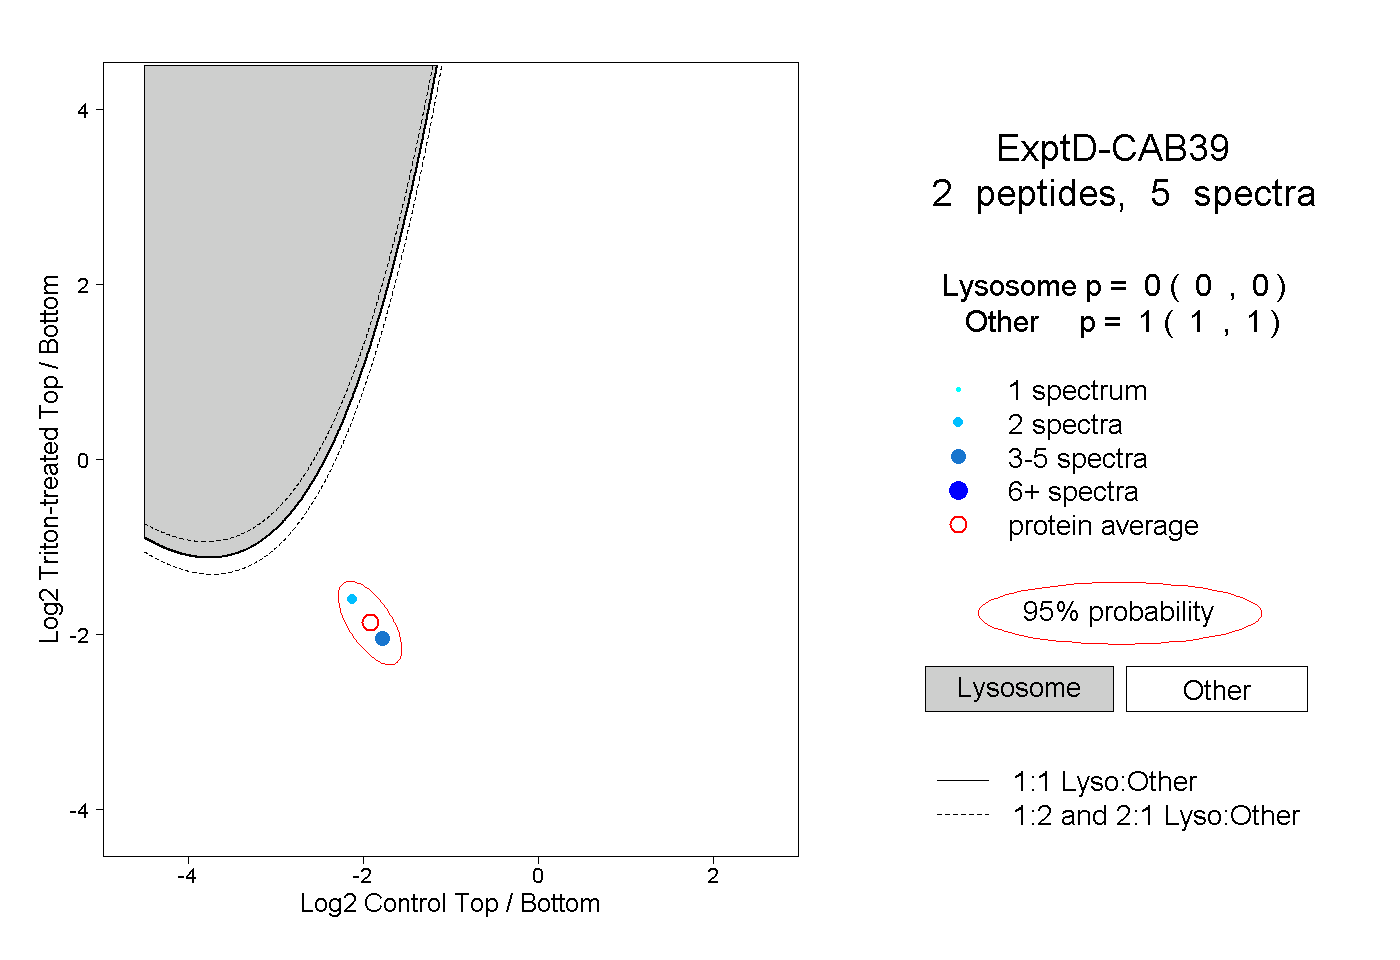 |
0.000 0.000 | 0.000 |
1.000 1.000 | 1.000 |