 31
31peptides
spectra
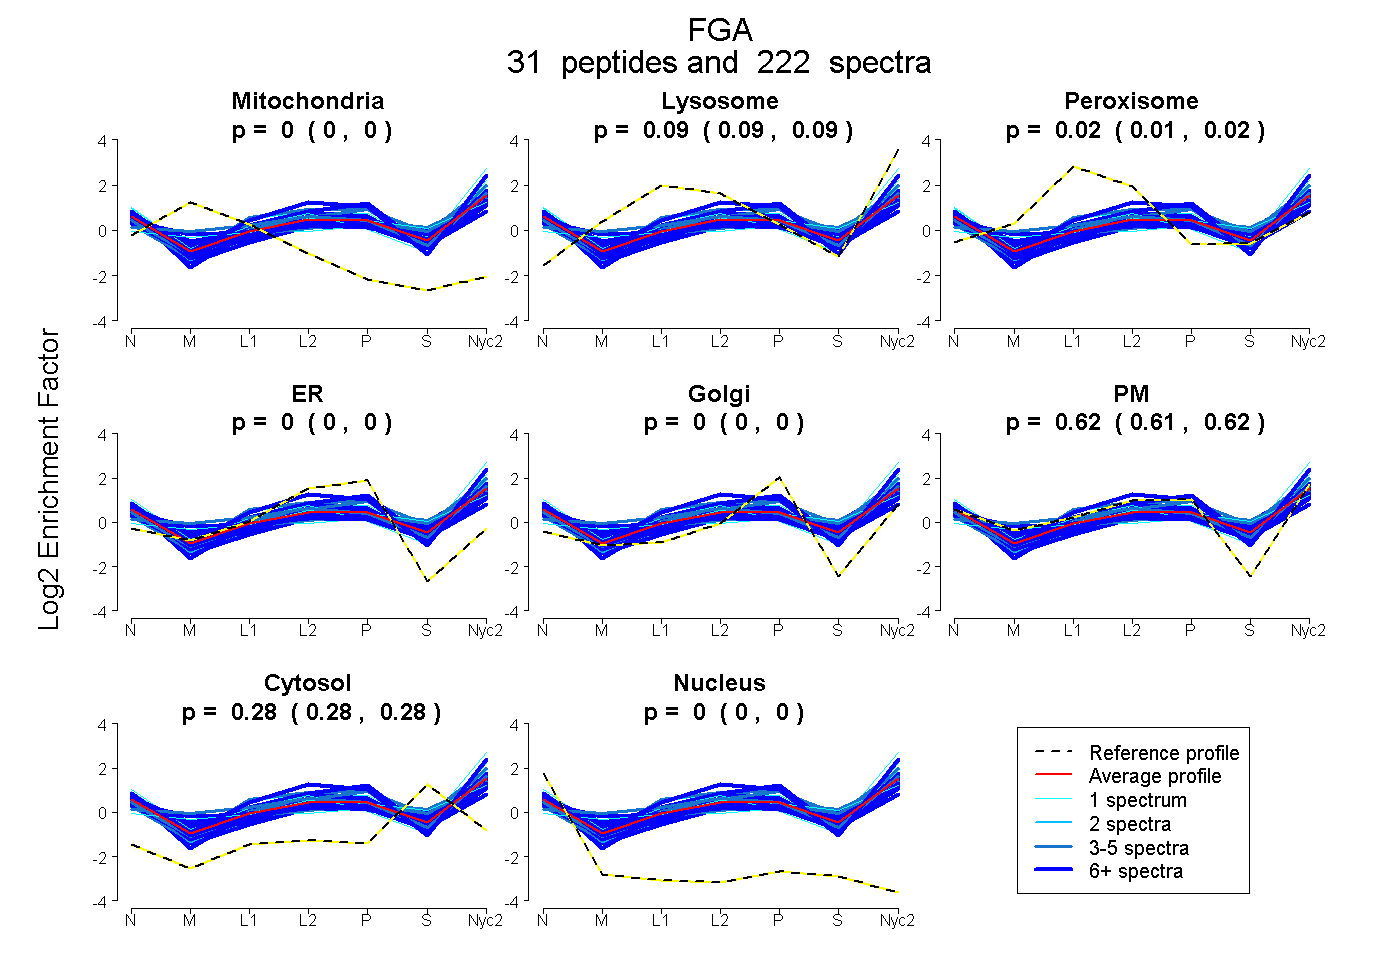
0.000 | 0.000
0.085 | 0.090
0.013 | 0.018
0.000 | 0.000
0.000 | 0.000
0.614 | 0.618
0.279 | 0.281
0.000 | 0.000
21peptides
spectra
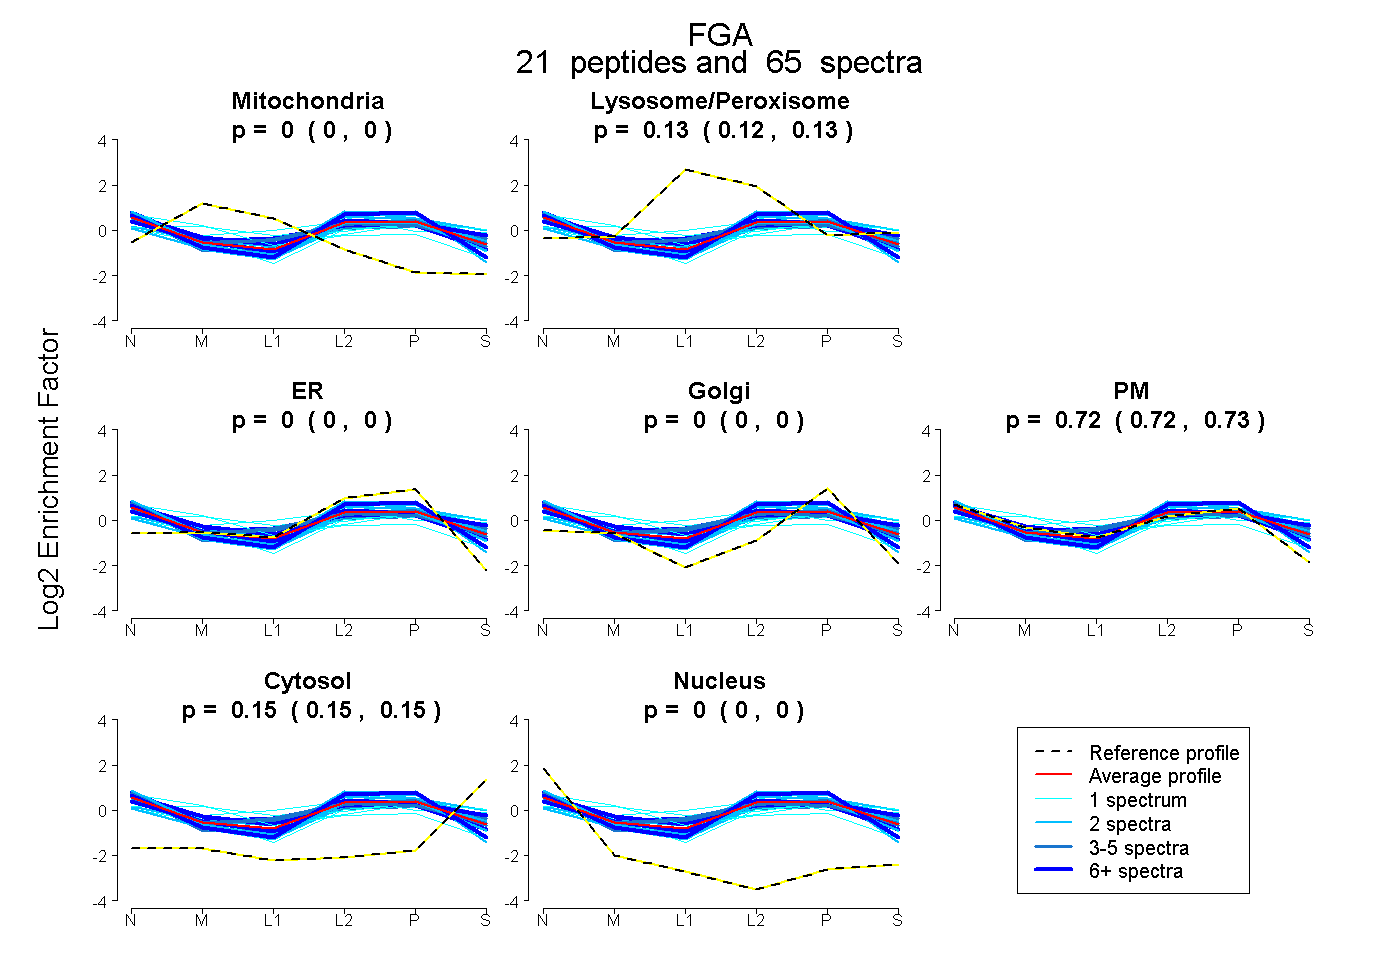
0.000 | 0.000
0.121 | 0.129
0.000 | 0.000
0.000 | 0.000
0.718 | 0.728
0.148 | 0.154
0.000 | 0.000
31peptides
spectra
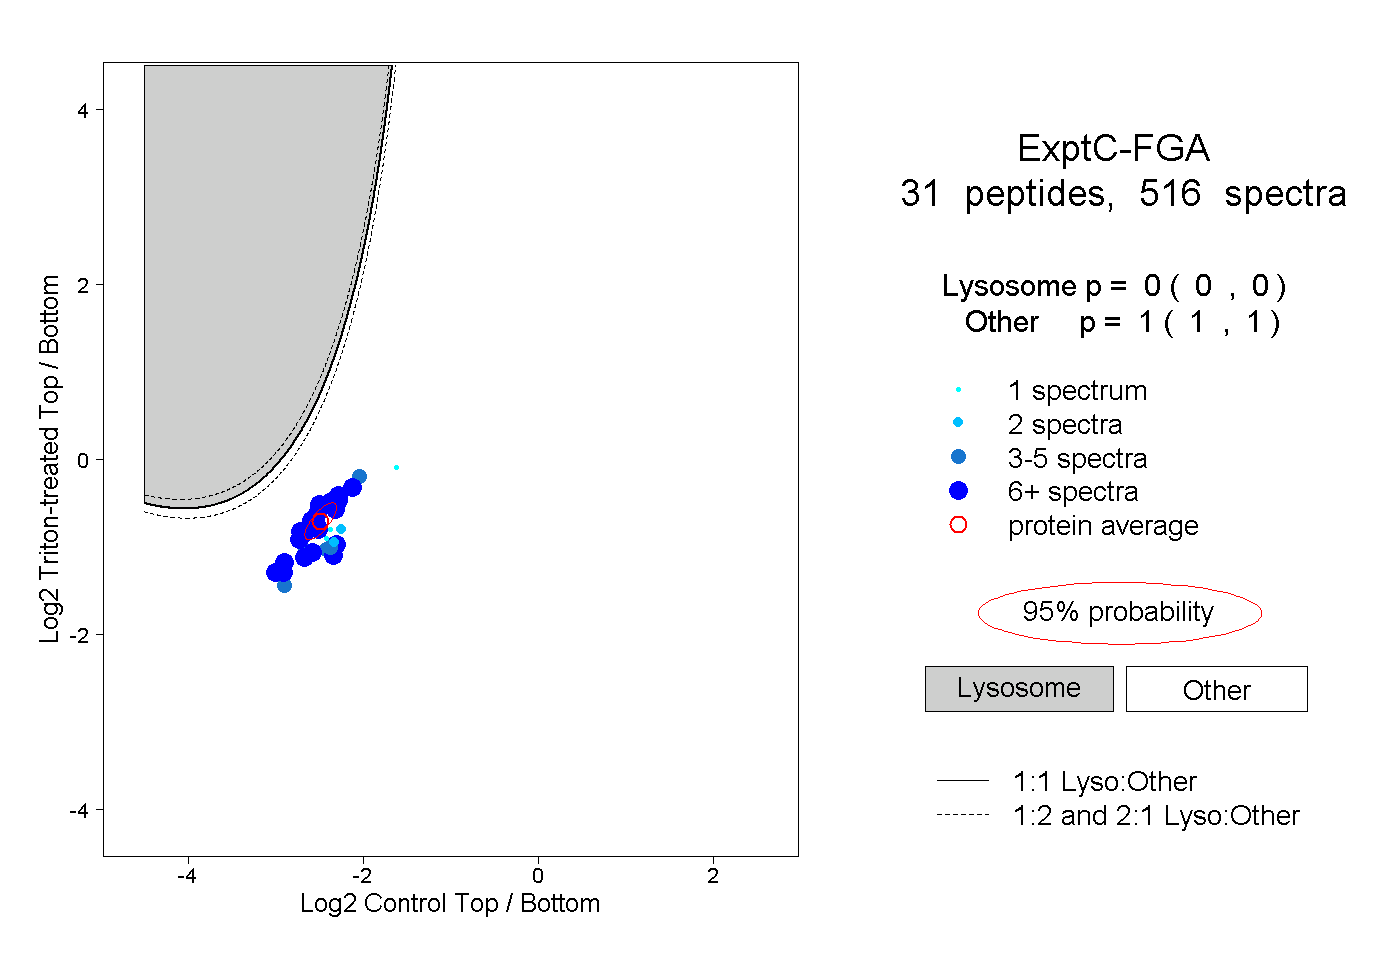
0.000 | 0.000
1.000 | 1.000
20peptides
spectra
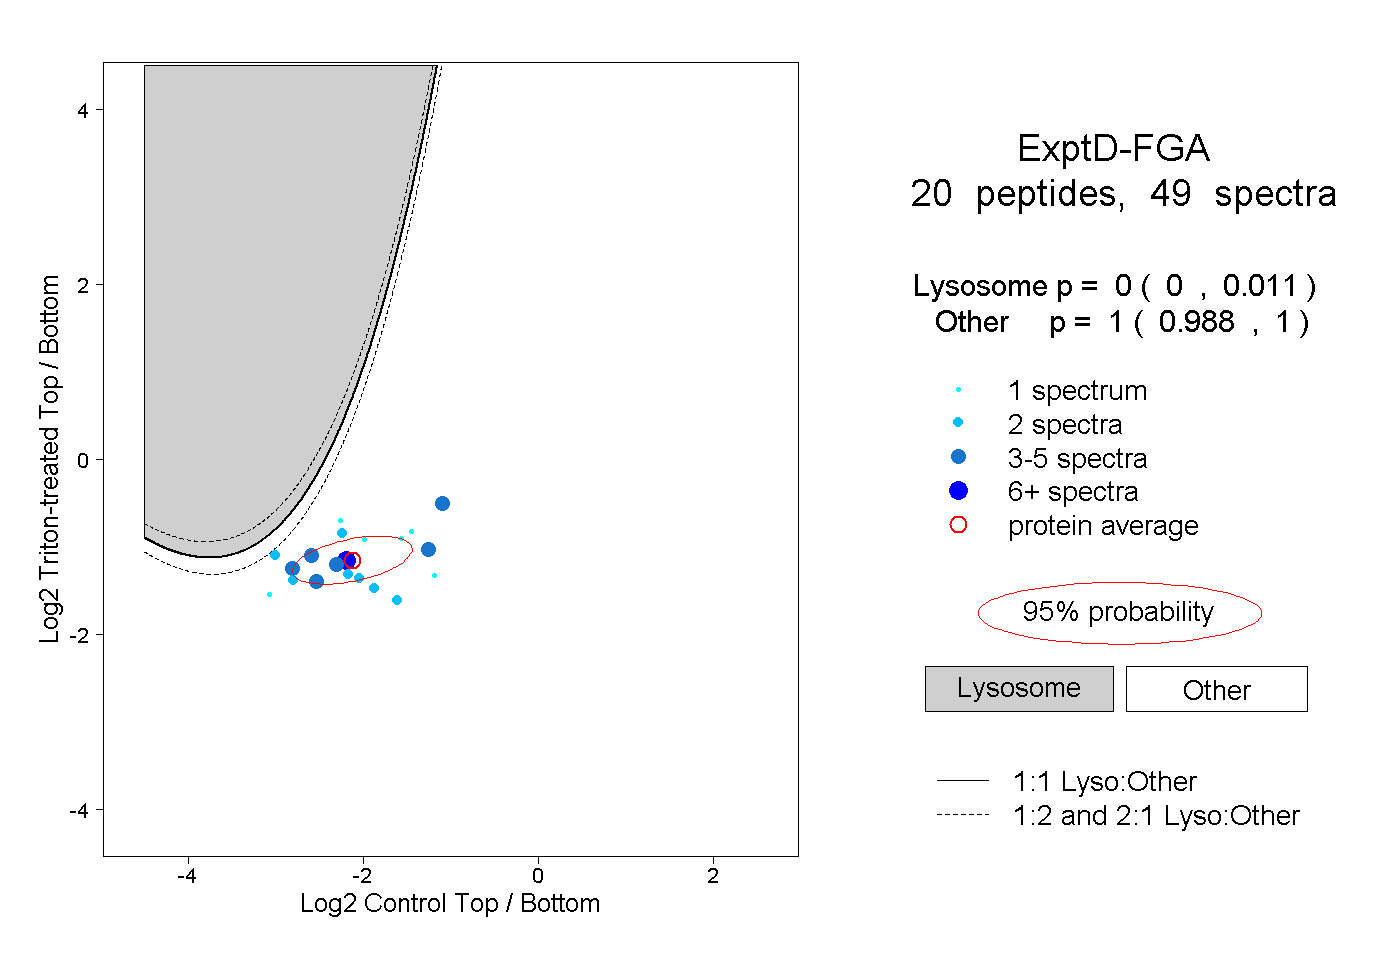
0.000 | 0.011
0.988 | 1.000