 17
17peptides
spectra
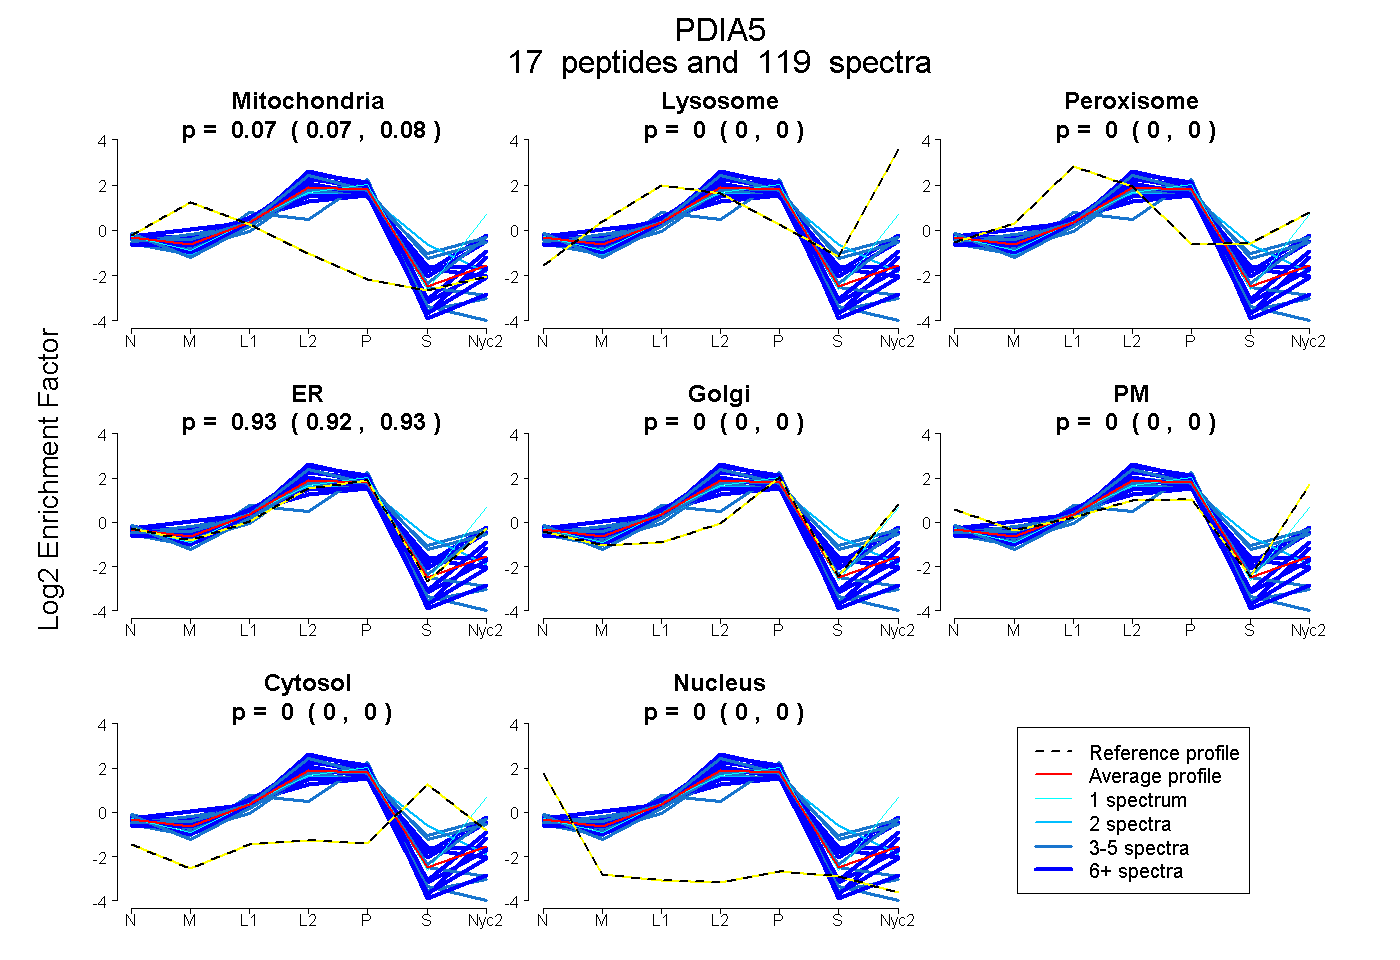
0.069 | 0.076
0.000 | 0.000
0.000 | 0.000
0.923 | 0.930
0.000 | 0.000
0.000 | 0.000
0.000 | 0.000
0.000 | 0.000
9peptides
spectra
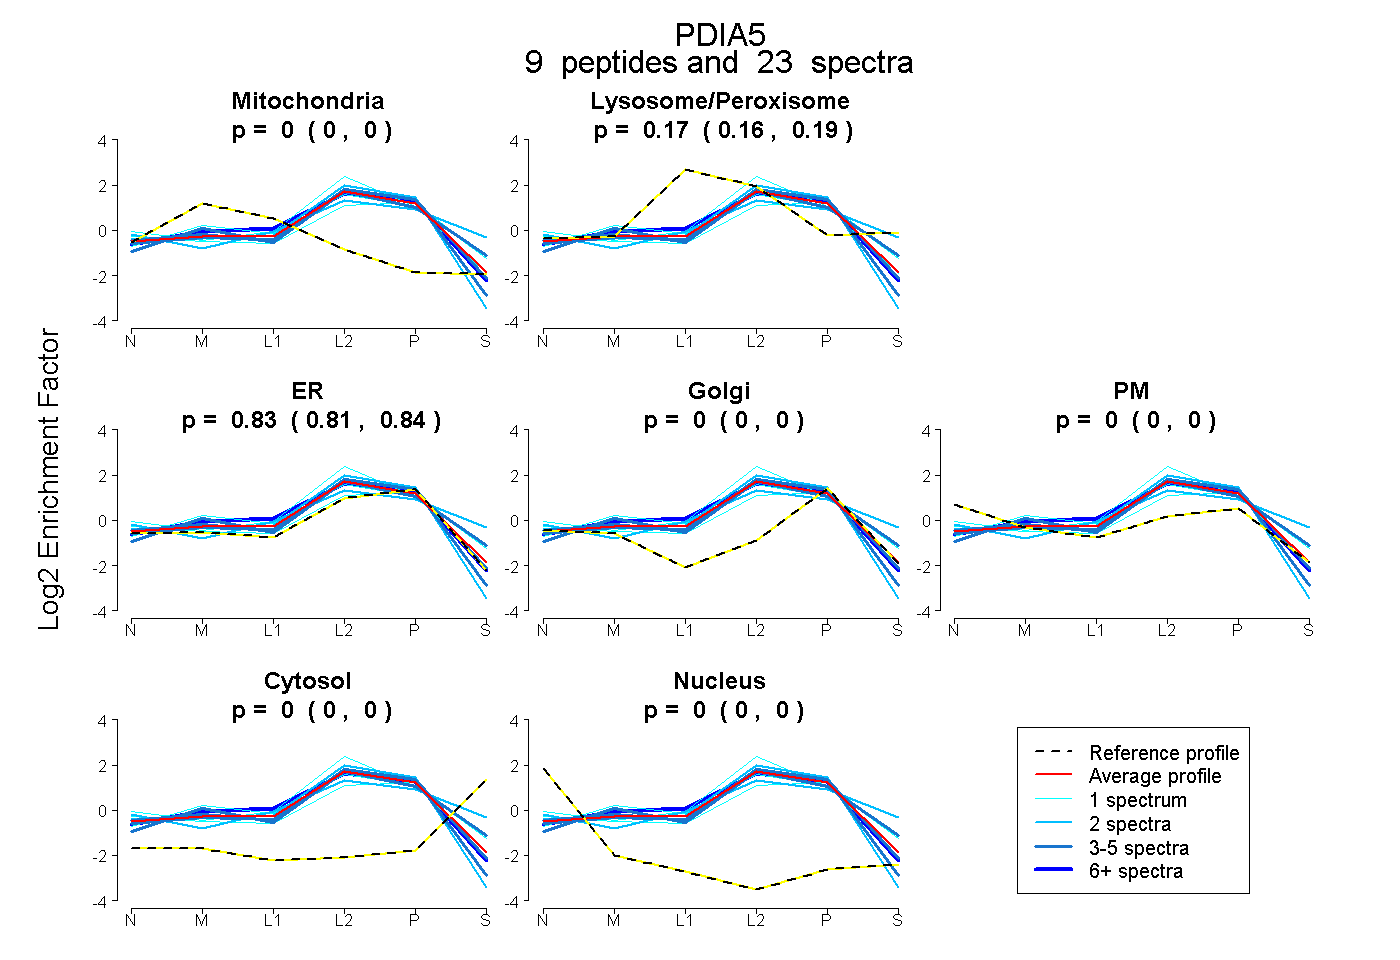
0.000 | 0.000
0.158 | 0.187
0.811 | 0.840
0.000 | 0.000
0.000 | 0.000
0.000 | 0.000
0.000 | 0.000
15peptides
spectra
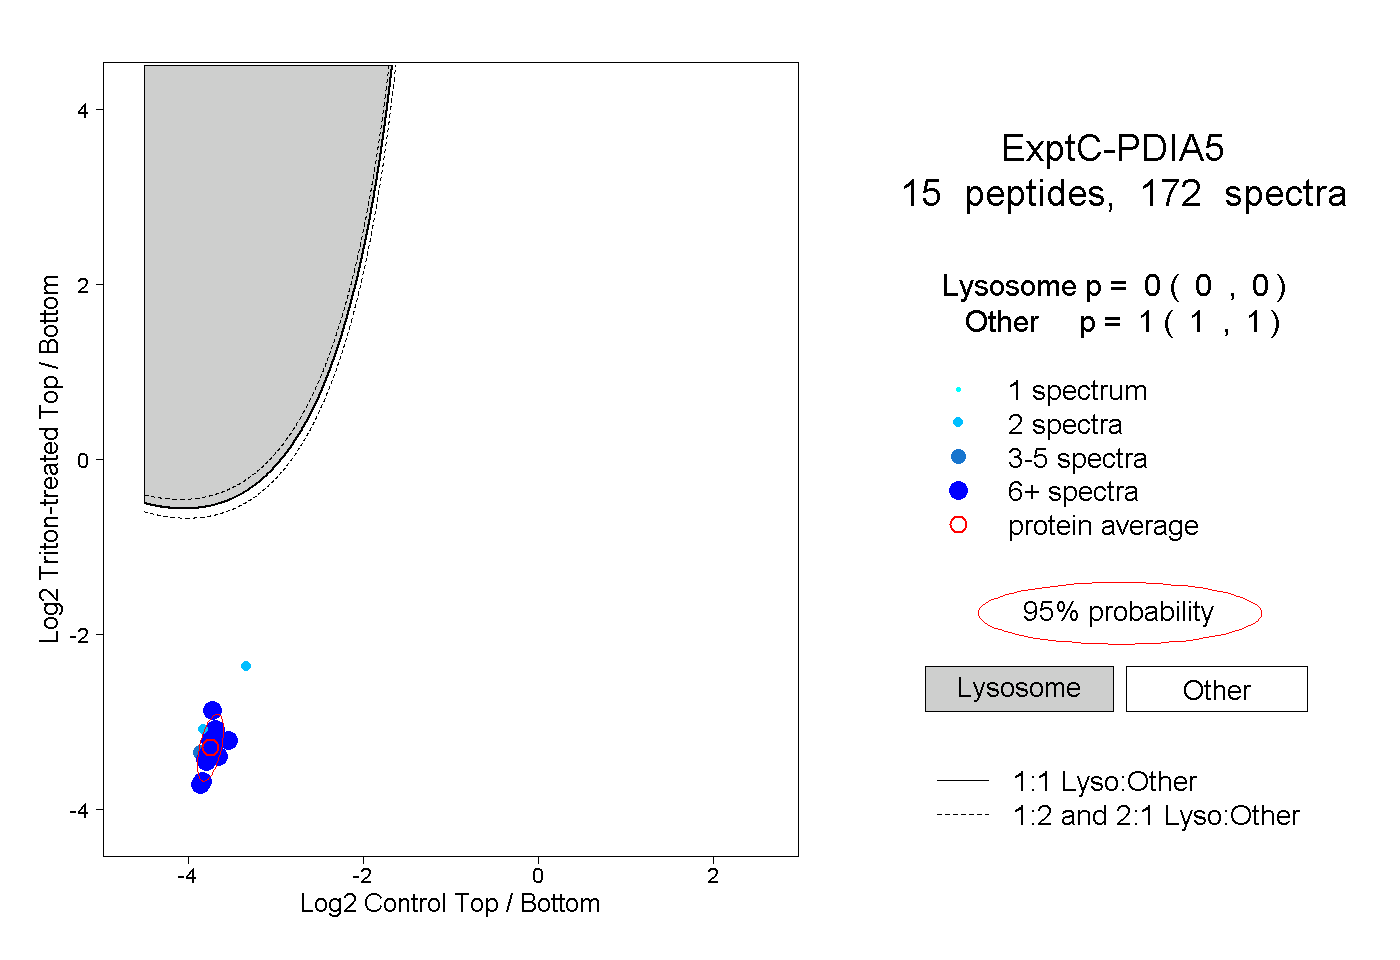
0.000 | 0.000
1.000 | 1.000
5peptides
spectra
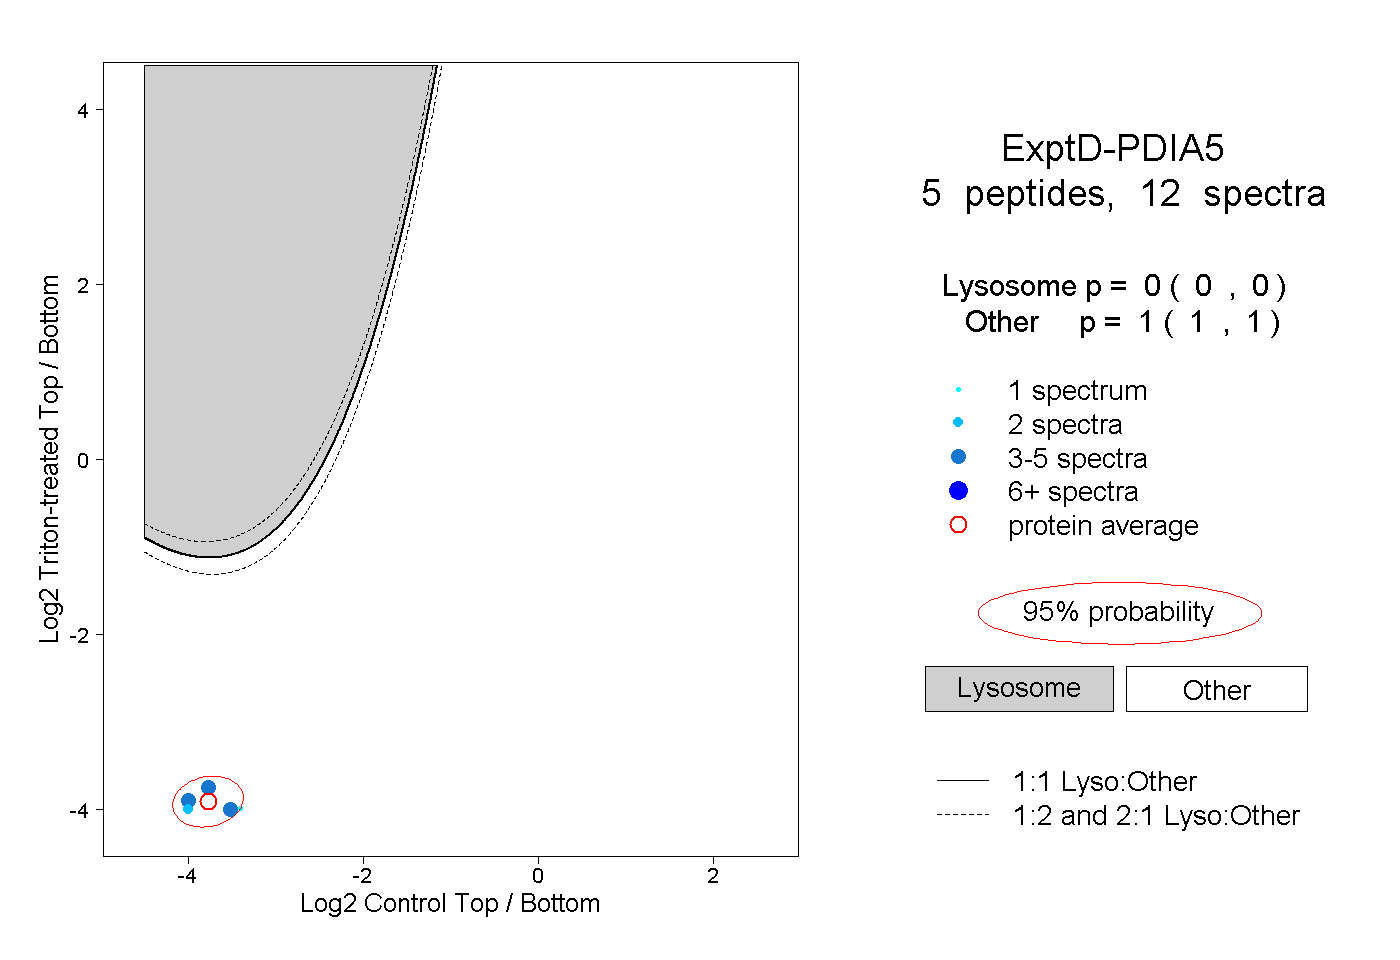
0.000 | 0.000
1.000 | 1.000