PDIA5
[ENSRNOP00000059945]
Main page
| | | Plot |
Mito |
Lyso |
|
Perox |
ER |
Golgi |
PM |
Cytosol |
Nucleus |
|
| Expt A |
 17
17
peptides |
119
spectra |
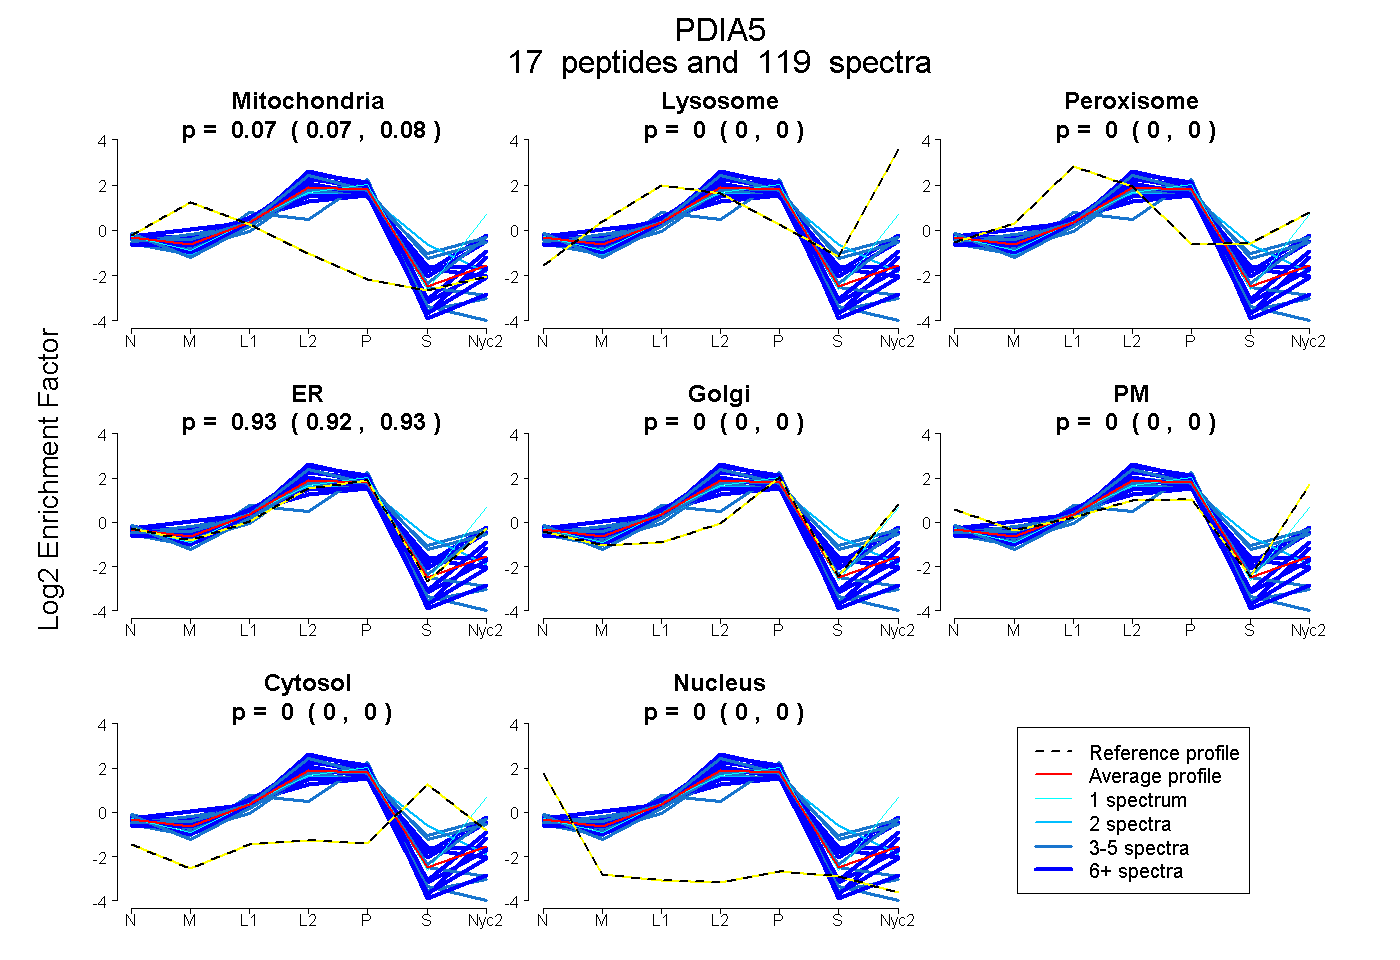 |
0.073
0.069 | 0.076 |
0.000
0.000 | 0.000 |
|
0.000
0.000 | 0.000 |
0.927
0.923 | 0.930 |
0.000
0.000 | 0.000 |
0.000
0.000 | 0.000 |
0.000
0.000 | 0.000 |
0.000
0.000 | 0.000 |
|
| | | Plot |
Mito |
|
Lyso or Perox |
|
ER |
Golgi |
PM |
Cytosol |
Nucleus |
|
| Expt B |
9
peptides |
23
spectra |
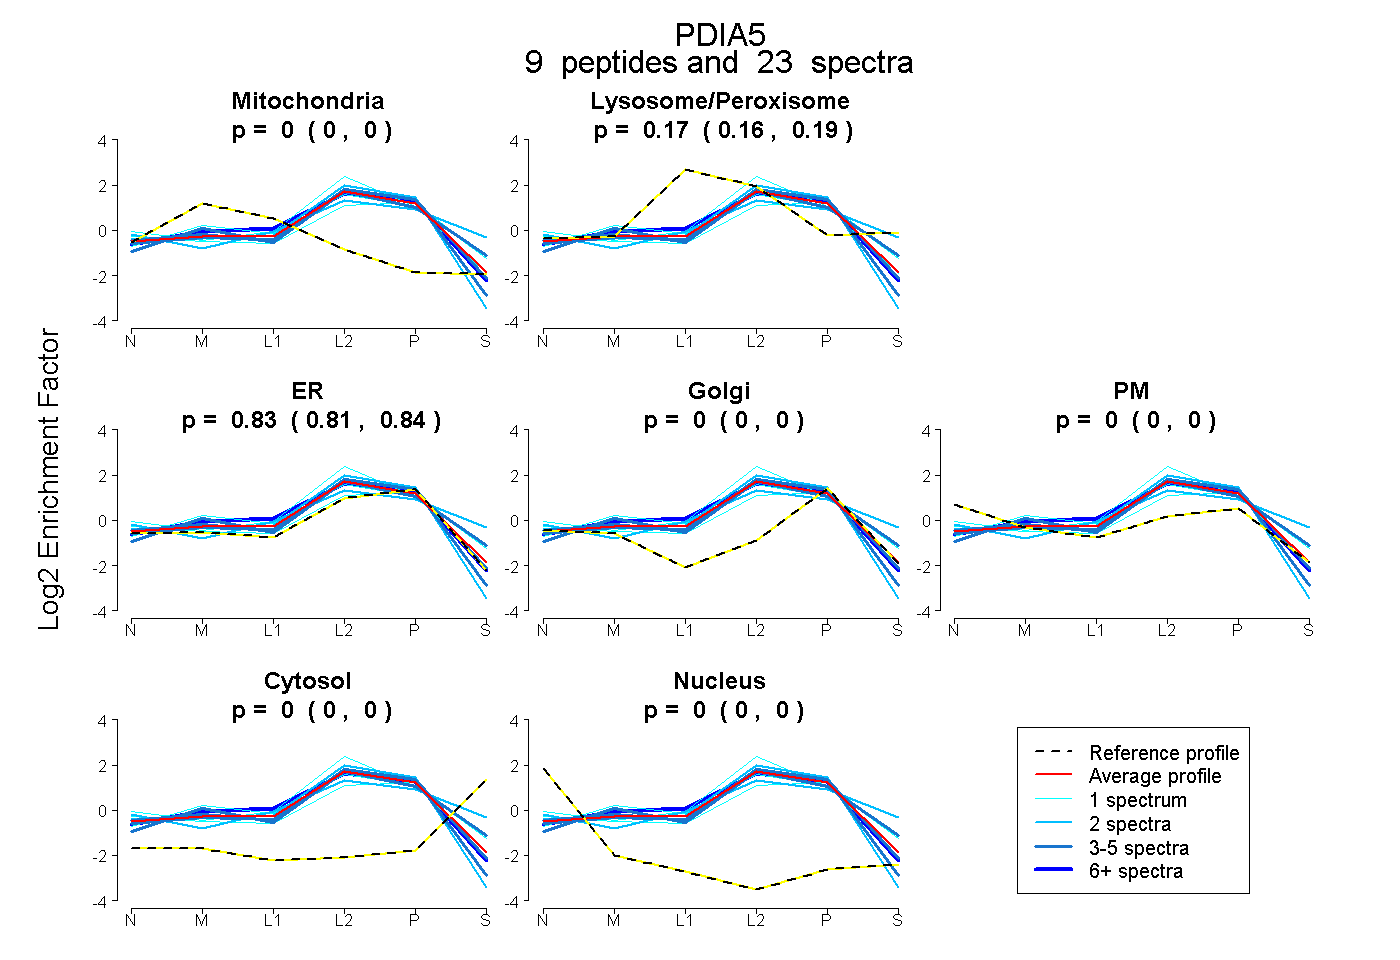 |
0.000
0.000 | 0.000 |
|
0.173
0.158 | 0.187 |
|
0.827
0.811 | 0.840 |
0.000
0.000 | 0.000 |
0.000
0.000 | 0.000 |
0.000
0.000 | 0.000 |
0.000
0.000 | 0.000 |
|
| 3 spectra, GYPTICYFEK |
0.000 |
|
0.024 |
|
0.976 |
0.000 |
0.000 |
0.000 |
0.000 |
|
| 2 spectra, GPPLWEEDPGAK |
0.000 |
|
0.009 |
|
0.991 |
0.000 |
0.000 |
0.000 |
0.000 |
|
| 1 spectrum, AYPTFHYYHYGK |
0.000 |
|
0.322 |
|
0.678 |
0.000 |
0.000 |
0.000 |
0.000 |
|
| 1 spectrum, EEYNVR |
0.000 |
|
0.164 |
|
0.657 |
0.083 |
0.058 |
0.037 |
0.000 |
|
| 3 spectra, SIVAFLK |
0.000 |
|
0.115 |
|
0.885 |
0.000 |
0.000 |
0.000 |
0.000 |
|
| 6 spectra, AATQVR |
0.000 |
|
0.186 |
|
0.814 |
0.000 |
0.000 |
0.000 |
0.000 |
|
| 1 spectrum, DVVHIDSEK |
0.017 |
|
0.194 |
|
0.790 |
0.000 |
0.000 |
0.000 |
0.000 |
|
| 2 spectra, FHISAFPTLK |
0.000 |
|
0.348 |
|
0.513 |
0.000 |
0.013 |
0.125 |
0.000 |
|
| 4 spectra, IMPHFQK |
0.000 |
|
0.209 |
|
0.752 |
0.000 |
0.000 |
0.039 |
0.000 |
|
| | | Plot |
|
Lyso |
|
|
|
|
|
|
|
Other |
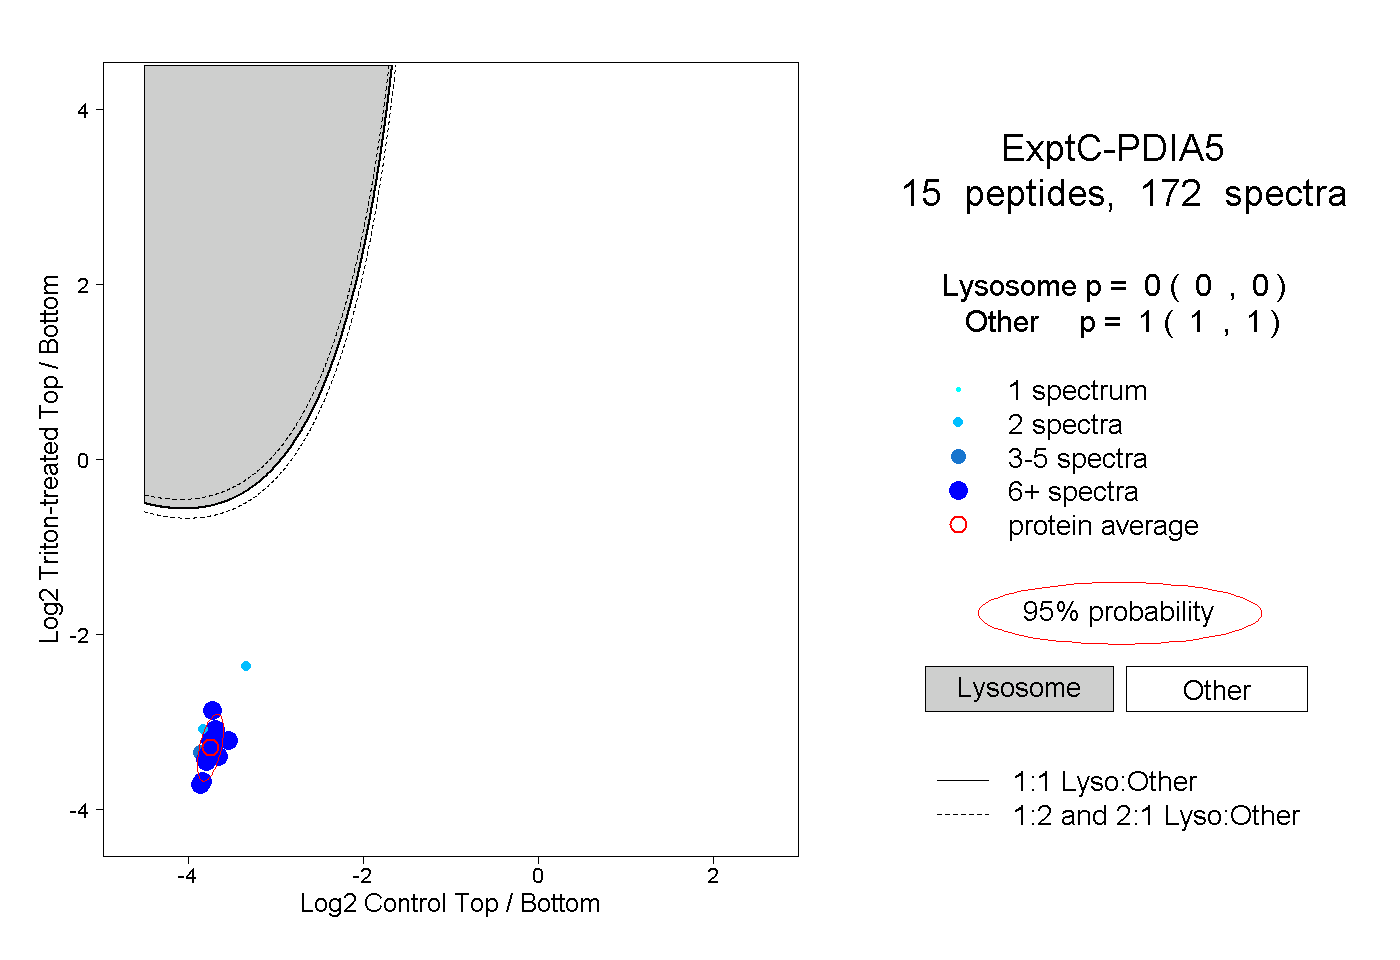
| Expt C |
15
peptides |
172
spectra |
 |
|
0.000
0.000 | 0.000 |
|
|
|
|
|
|
|
1.000
1.000 | 1.000 |
| | | Plot |
|
Lyso |
|
|
|
|
|
|
|
Other |
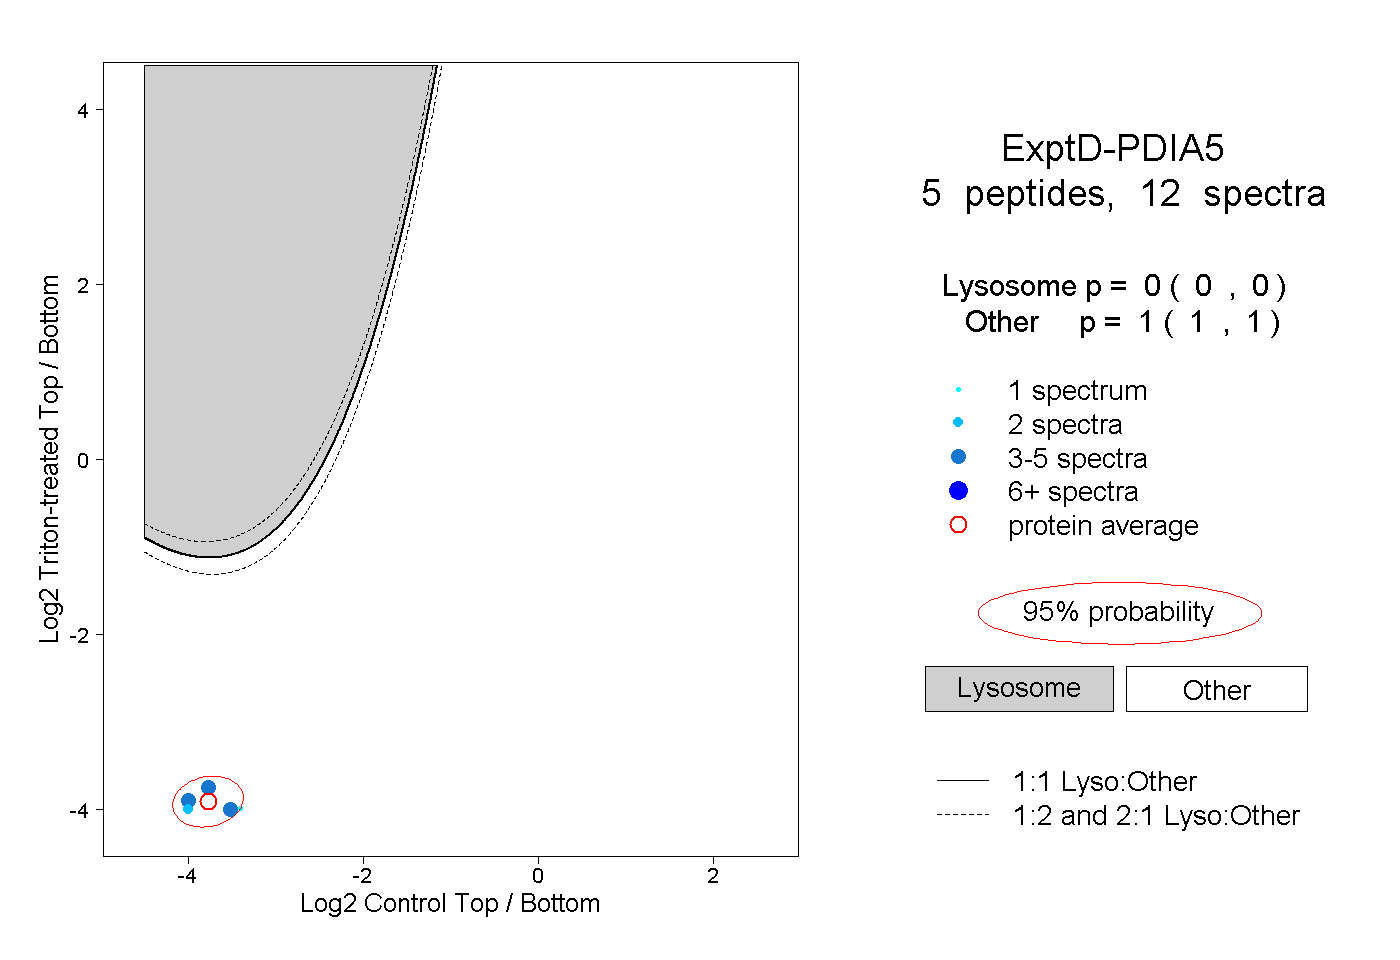
| Expt D |
5
peptides |
12
spectra |
 |
|
0.000
0.000 | 0.000 |
|
|
|
|
|
|
|
1.000
1.000 | 1.000 |