 14
14peptides
spectra
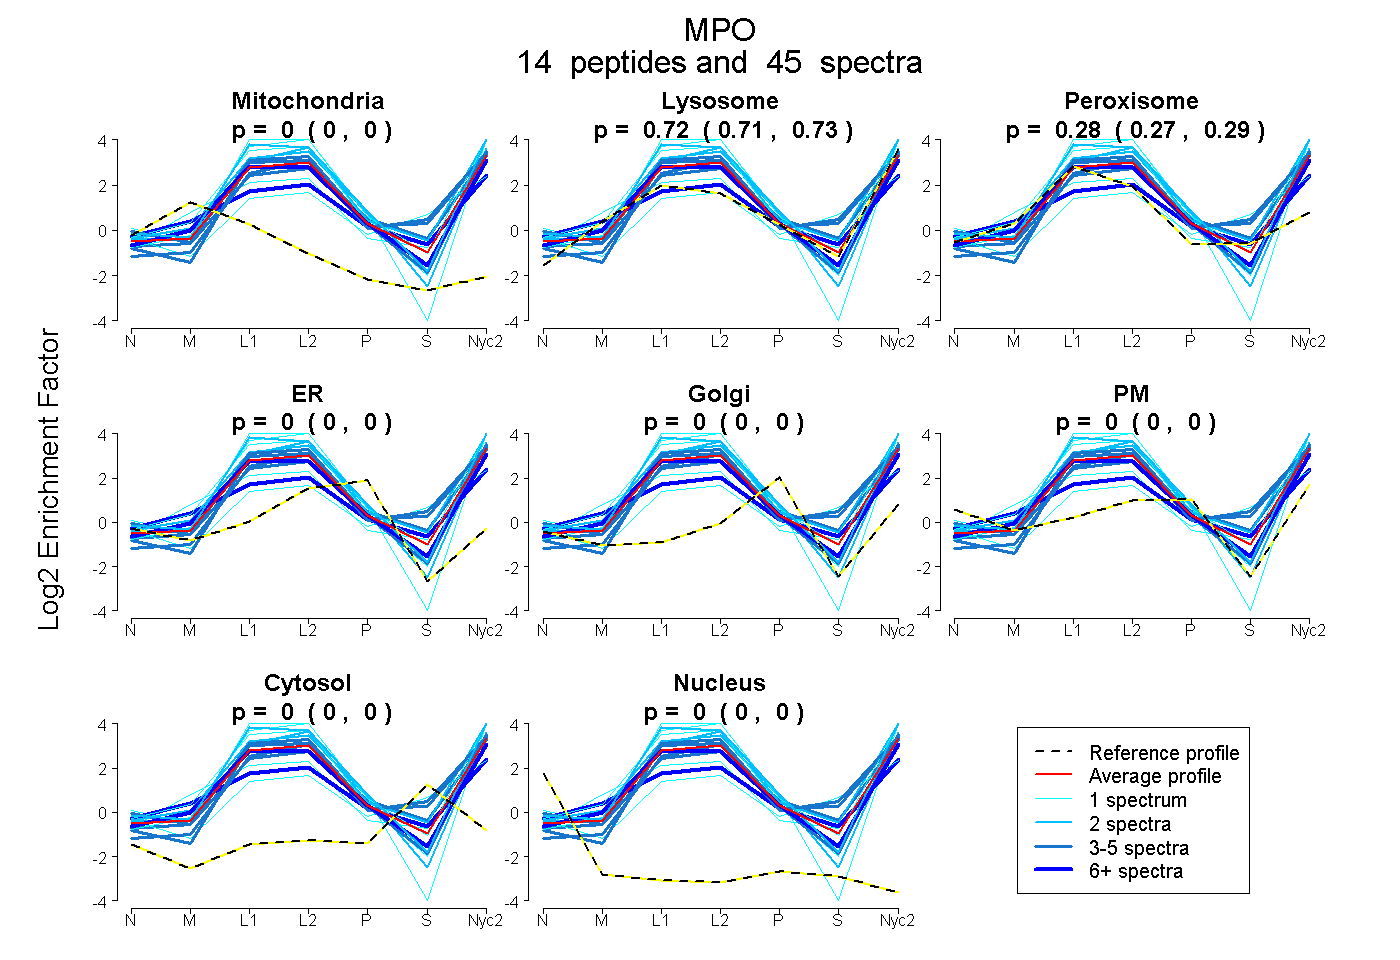
0.000 | 0.000
0.707 | 0.733
0.265 | 0.291
0.000 | 0.000
0.000 | 0.000
0.000 | 0.000
0.000 | 0.000
0.000 | 0.000
7peptides
spectra
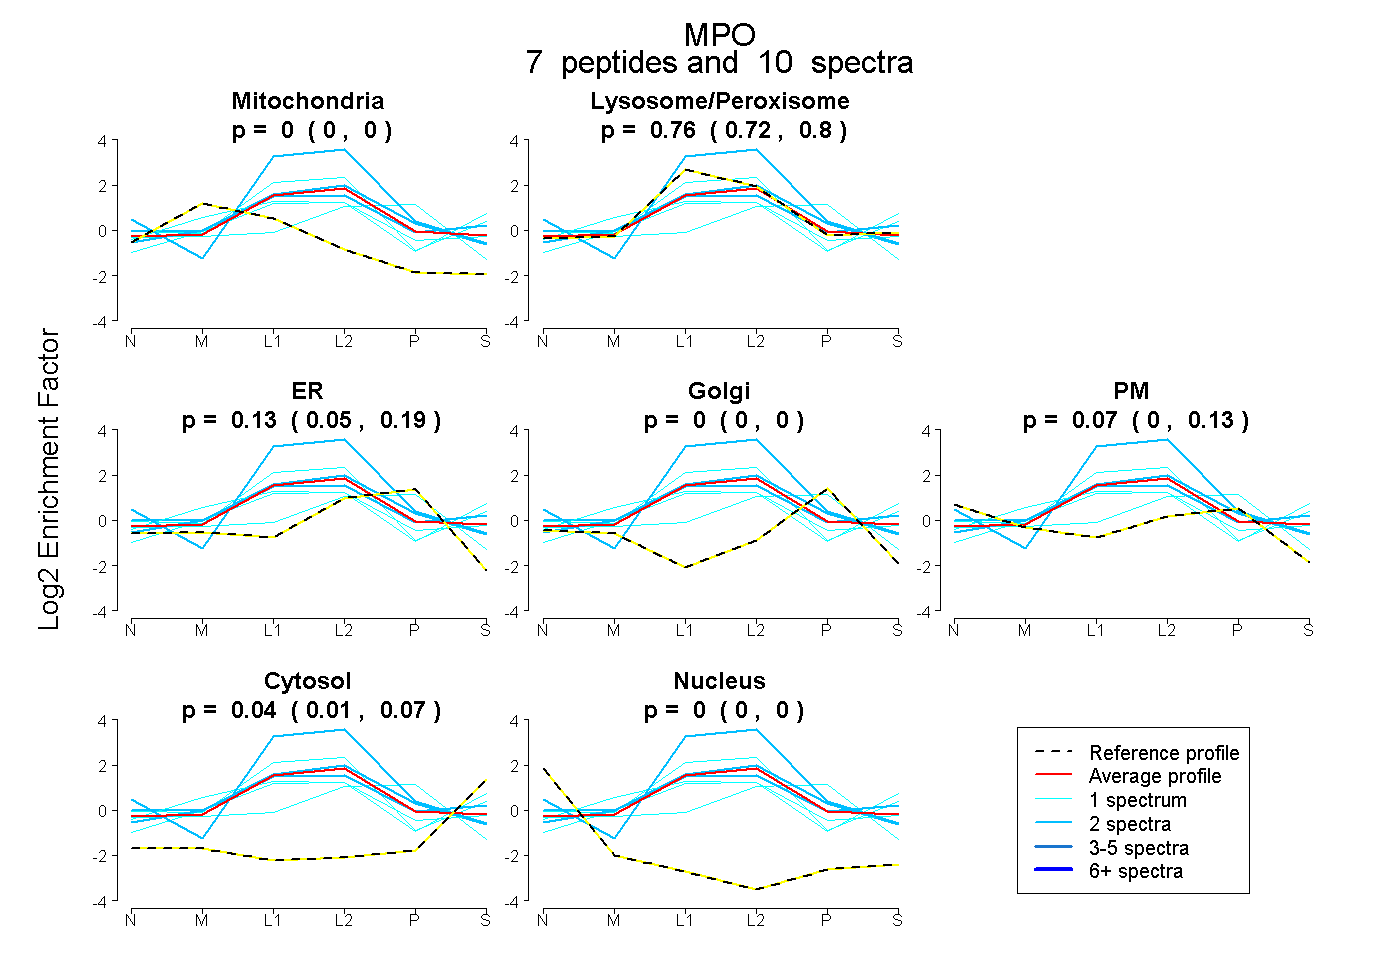
0.000 | 0.000
0.716 | 0.804
0.046 | 0.194
0.000 | 0.000
0.000 | 0.132
0.010 | 0.065
0.000 | 0.000
32peptides
spectra
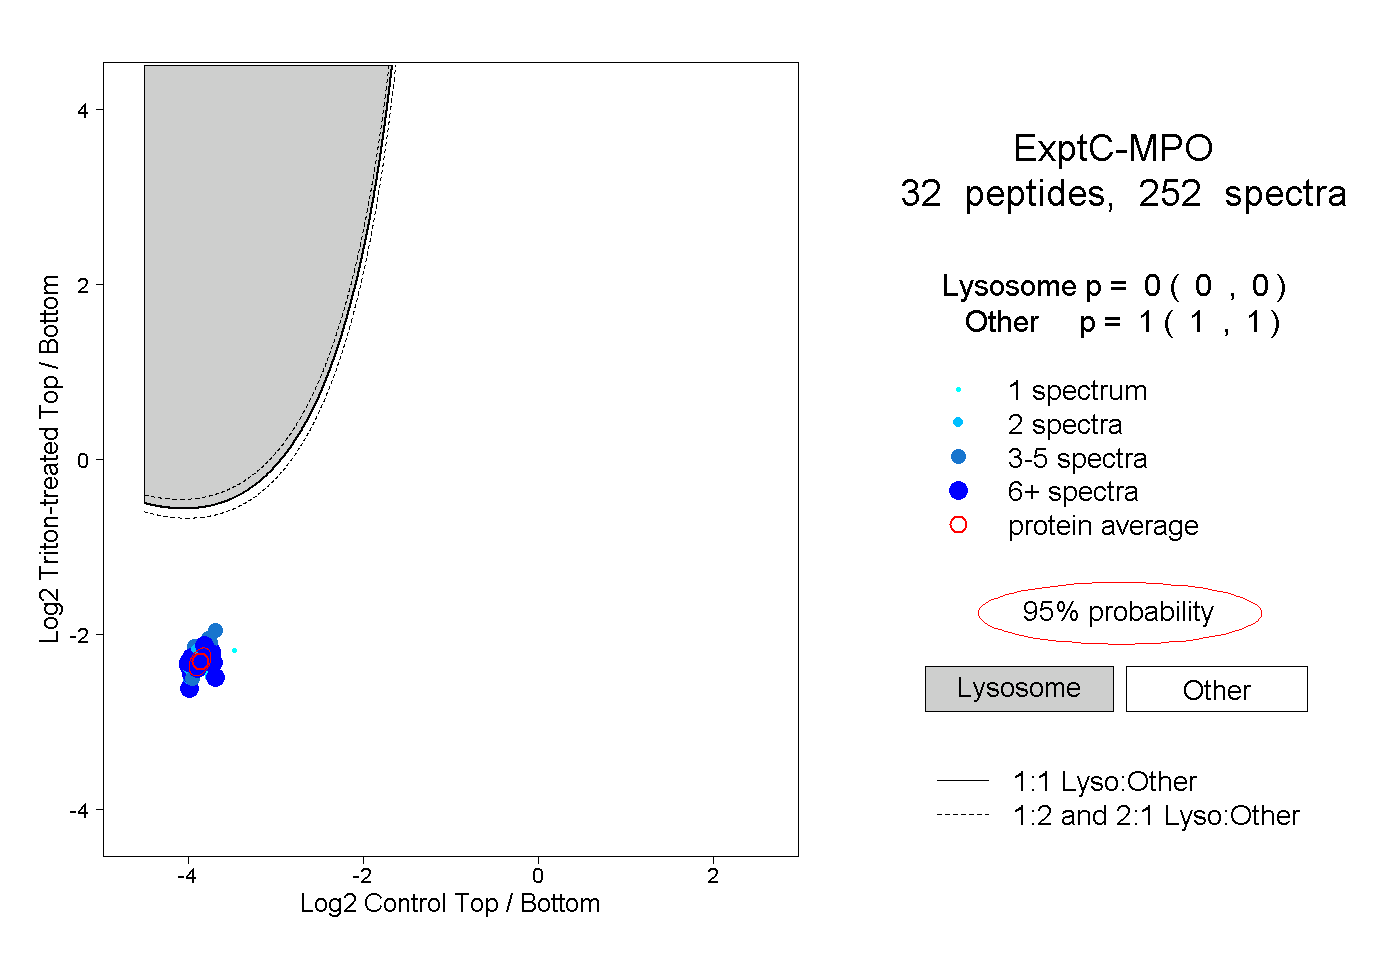
0.000 | 0.000
1.000 | 1.000
11peptides
spectra
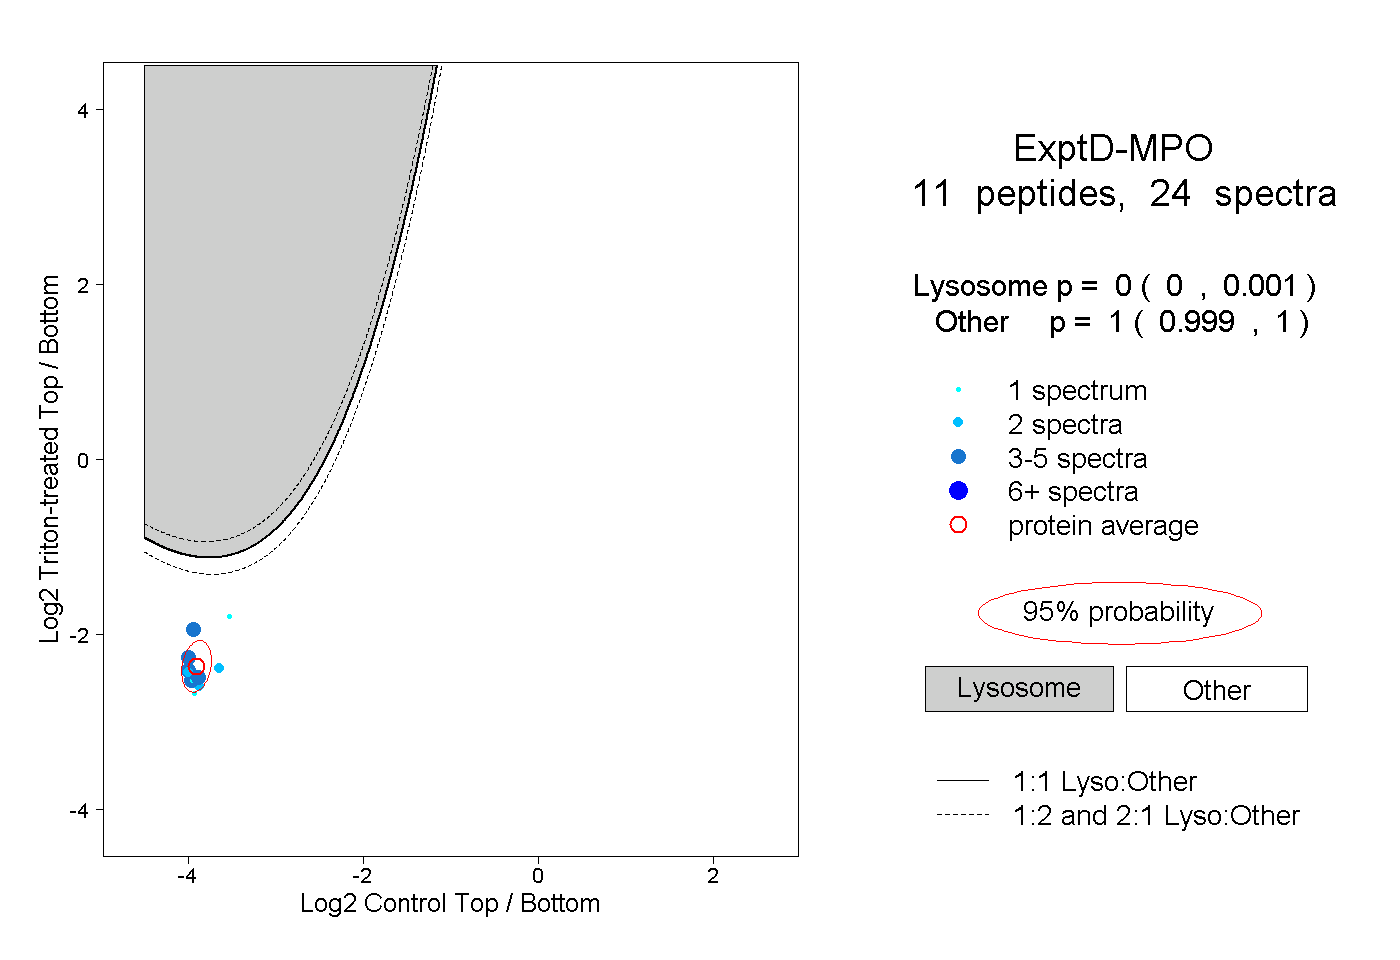
0.000 | 0.001
0.999 | 1.000