 14
14peptides
spectra
0.000 | 0.000
0.707 | 0.733
0.265 | 0.291
0.000 | 0.000
0.000 | 0.000
0.000 | 0.000
0.000 | 0.000
0.000 | 0.000
| Plot | Mito | Lyso | Perox | ER | Golgi | PM | Cytosol | Nucleus | |||||
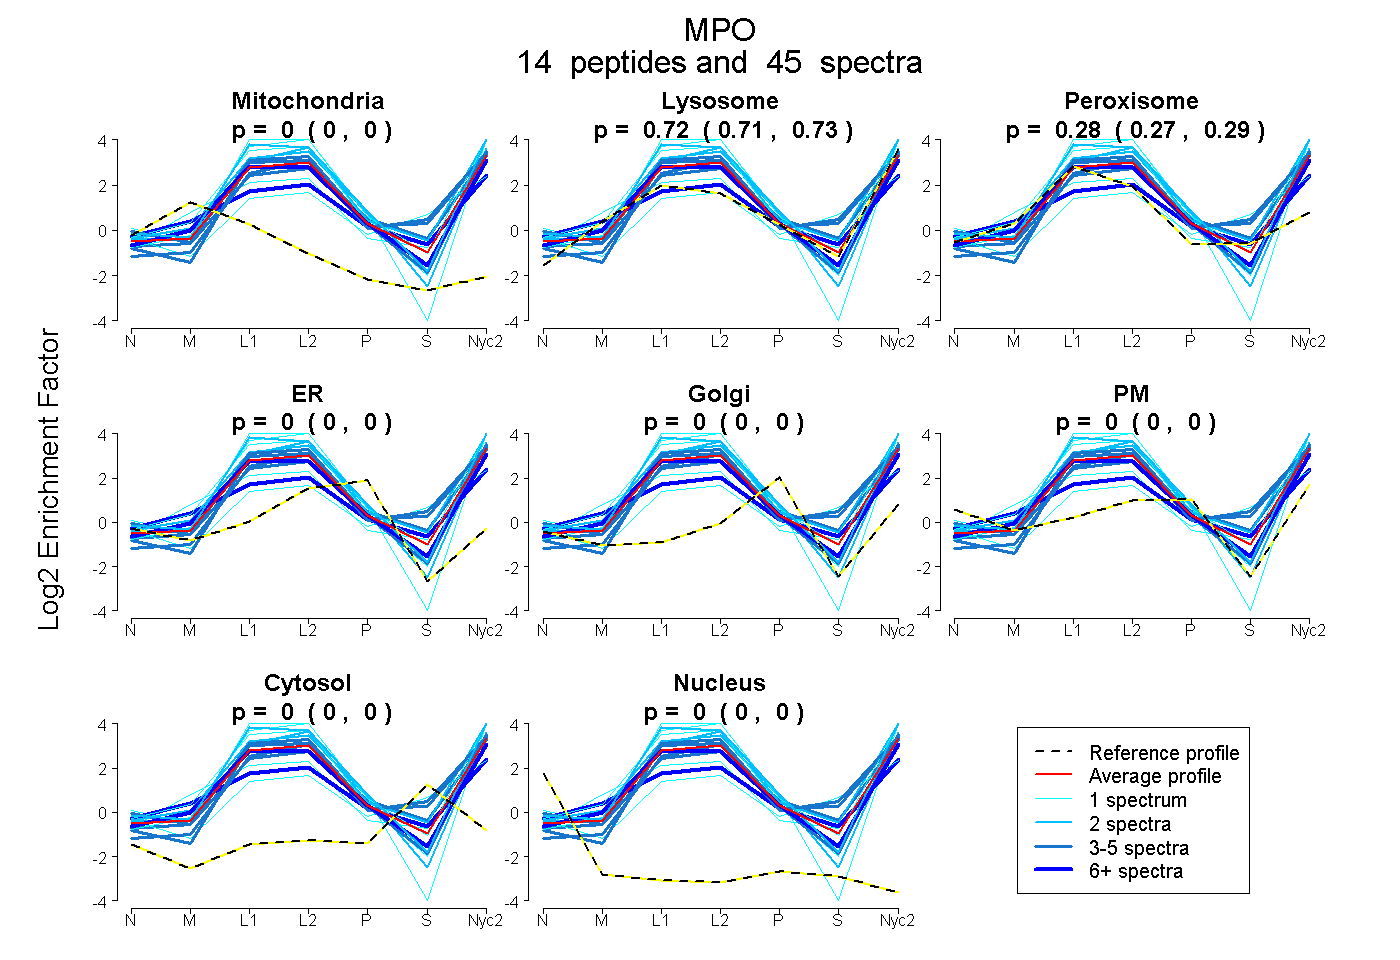
| Expt A |
14 peptides |
45 spectra |
|
0.000 0.000 | 0.000 |
0.722 0.707 | 0.733 |
0.278 0.265 | 0.291 |
0.000 0.000 | 0.000 |
0.000 0.000 | 0.000 |
0.000 0.000 | 0.000 |
0.000 0.000 | 0.000 |
0.000 0.000 | 0.000 |
| 4 spectra, VFFASWR | 0.000 | 0.732 | 0.268 | 0.000 | 0.000 | 0.000 | 0.000 | 0.000 | ||
| 10 spectra, LDNQYR | 0.000 | 0.440 | 0.377 | 0.000 | 0.000 | 0.182 | 0.000 | 0.000 | ||
| 6 spectra, YGHTLIQPFMFR | 0.000 | 0.698 | 0.286 | 0.000 | 0.000 | 0.017 | 0.000 | 0.000 | ||
| 4 spectra, SPTLGASNR | 0.000 | 0.658 | 0.342 | 0.000 | 0.000 | 0.000 | 0.000 | 0.000 | ||
| 1 spectrum, IICDNTGITTVSK | 0.000 | 0.818 | 0.032 | 0.000 | 0.000 | 0.150 | 0.000 | 0.000 | ||
| 1 spectrum, LYQEAR | 0.000 | 0.494 | 0.258 | 0.000 | 0.000 | 0.000 | 0.248 | 0.000 | ||
| 5 spectra, VVLEGGIDPILR | 0.000 | 0.697 | 0.245 | 0.000 | 0.000 | 0.058 | 0.000 | 0.000 | ||
| 1 spectrum, QVSNAIVR | 0.000 | 0.862 | 0.138 | 0.000 | 0.000 | 0.000 | 0.000 | 0.000 | ||
| 5 spectra, IGLDLPALNMQR | 0.000 | 0.756 | 0.244 | 0.000 | 0.000 | 0.000 | 0.000 | 0.000 | ||
| 1 spectrum, STGPNPR | 0.000 | 0.851 | 0.149 | 0.000 | 0.000 | 0.000 | 0.000 | 0.000 | ||
| 2 spectra, QALATISLPR | 0.000 | 0.825 | 0.109 | 0.000 | 0.000 | 0.066 | 0.000 | 0.000 | ||
| 2 spectra, QNQIAVDEIR | 0.000 | 0.836 | 0.164 | 0.000 | 0.000 | 0.000 | 0.000 | 0.000 | ||
| 2 spectra, YLPQYR | 0.000 | 0.852 | 0.148 | 0.000 | 0.000 | 0.000 | 0.000 | 0.000 | ||
| 1 spectrum, IPCFLAGDMR | 0.000 | 0.681 | 0.319 | 0.000 | 0.000 | 0.000 | 0.000 | 0.000 |
| Plot | Mito | Lyso or Perox | ER | Golgi | PM | Cytosol | Nucleus | ||||||
| Expt B |
7 peptides |
10 spectra |
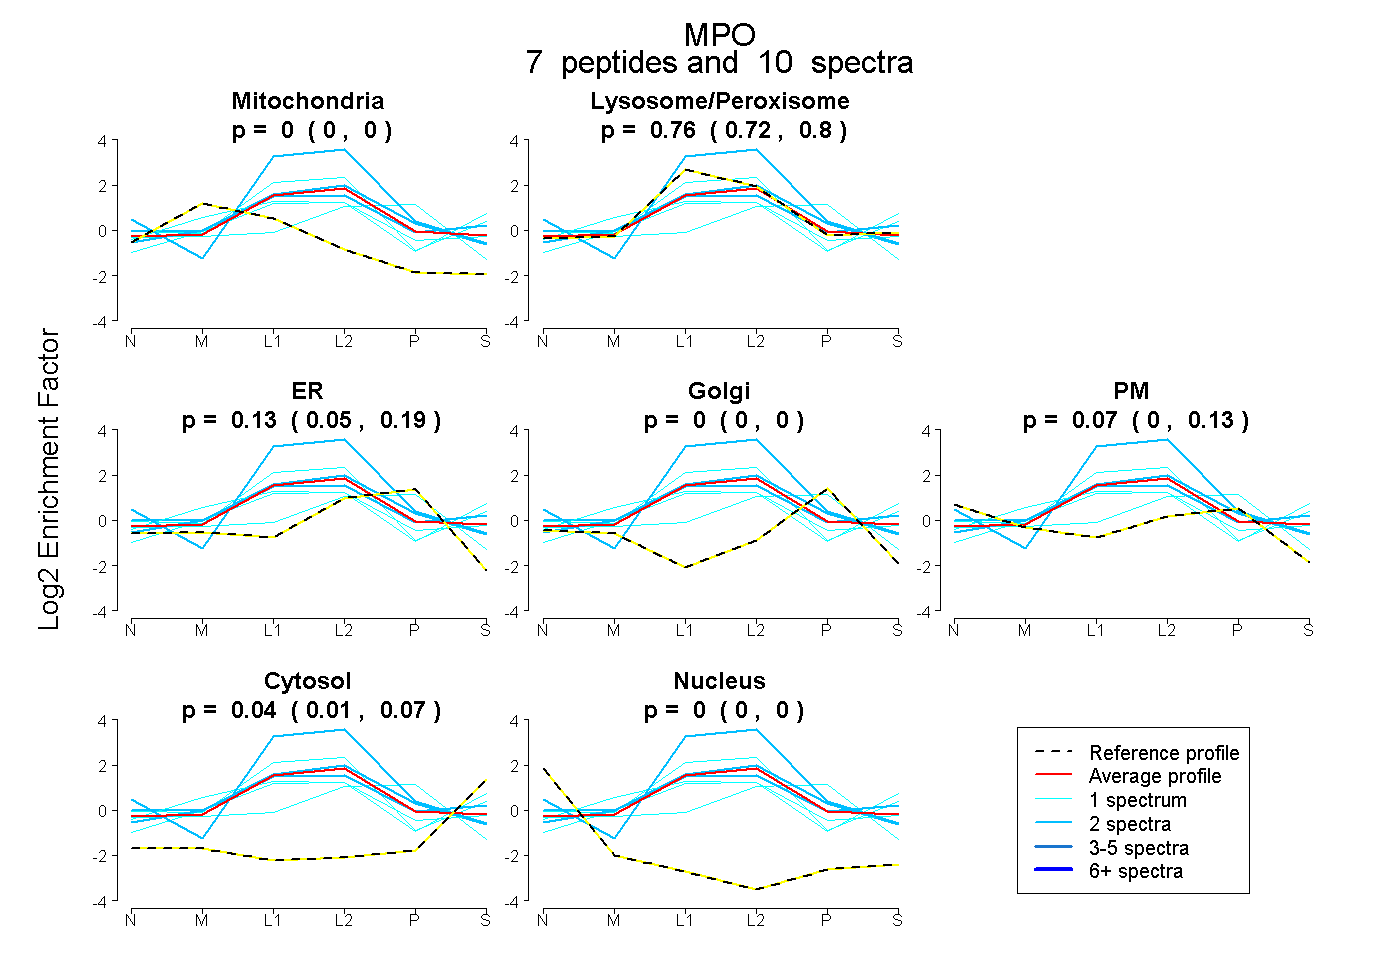 |
0.000 0.000 | 0.000 |
0.762 0.716 | 0.804 |
0.128 0.046 | 0.194 |
0.000 0.000 | 0.000 |
0.070 0.000 | 0.132 |
0.040 0.010 | 0.065 |
0.000 0.000 | 0.000 |
|||
| Plot | Lyso | Other | |||||||||||
| Expt C |
32 peptides |
252 spectra |
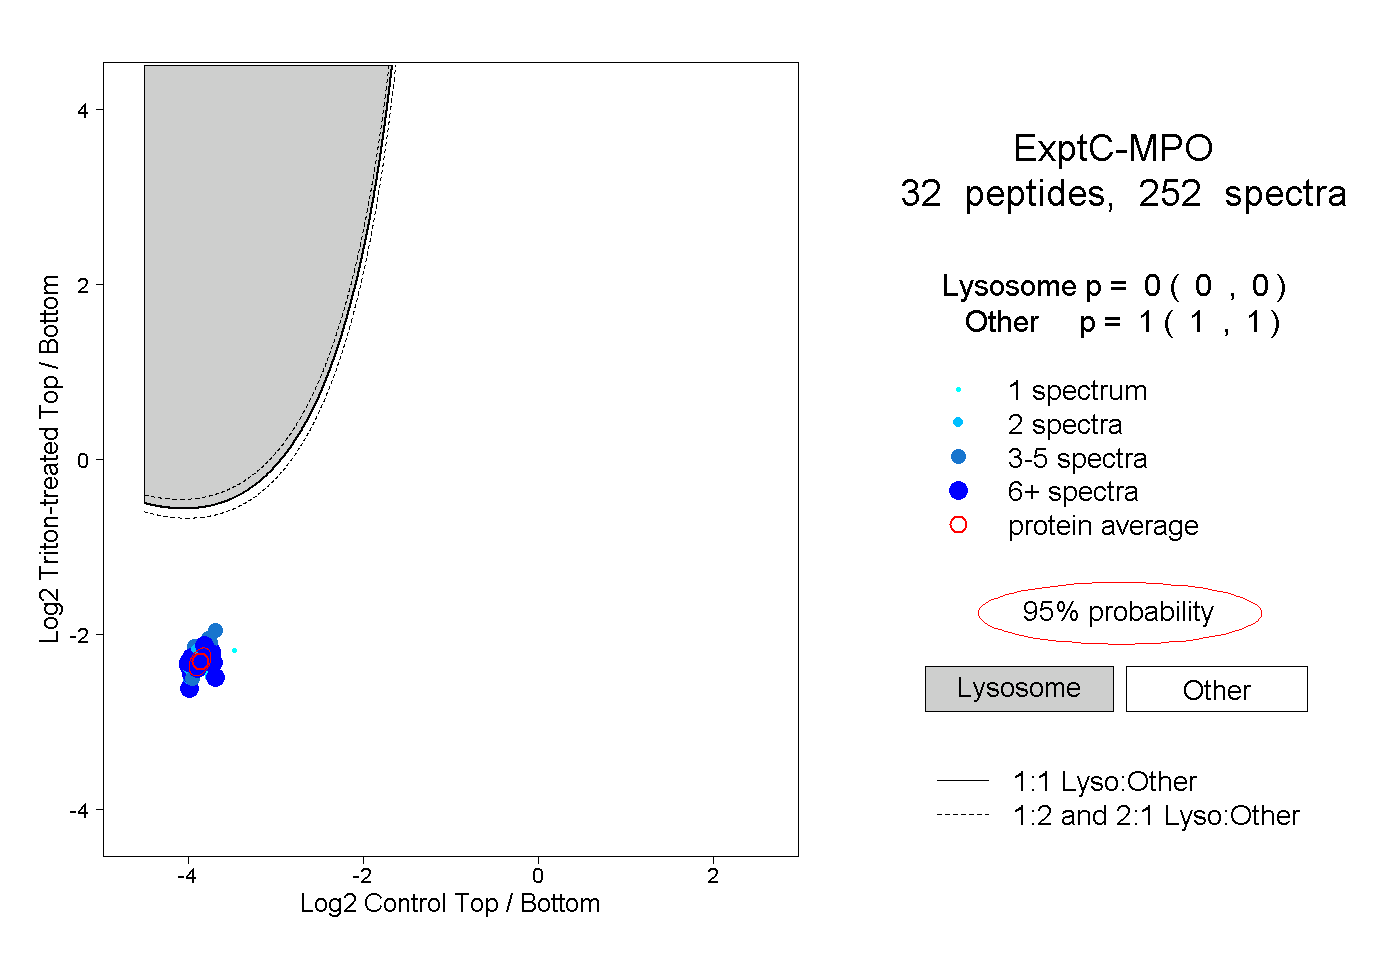 |
0.000 0.000 | 0.000 |
1.000 1.000 | 1.000 |
||||||||
| Plot | Lyso | Other | |||||||||||
| Expt D |
11 peptides |
24 spectra |
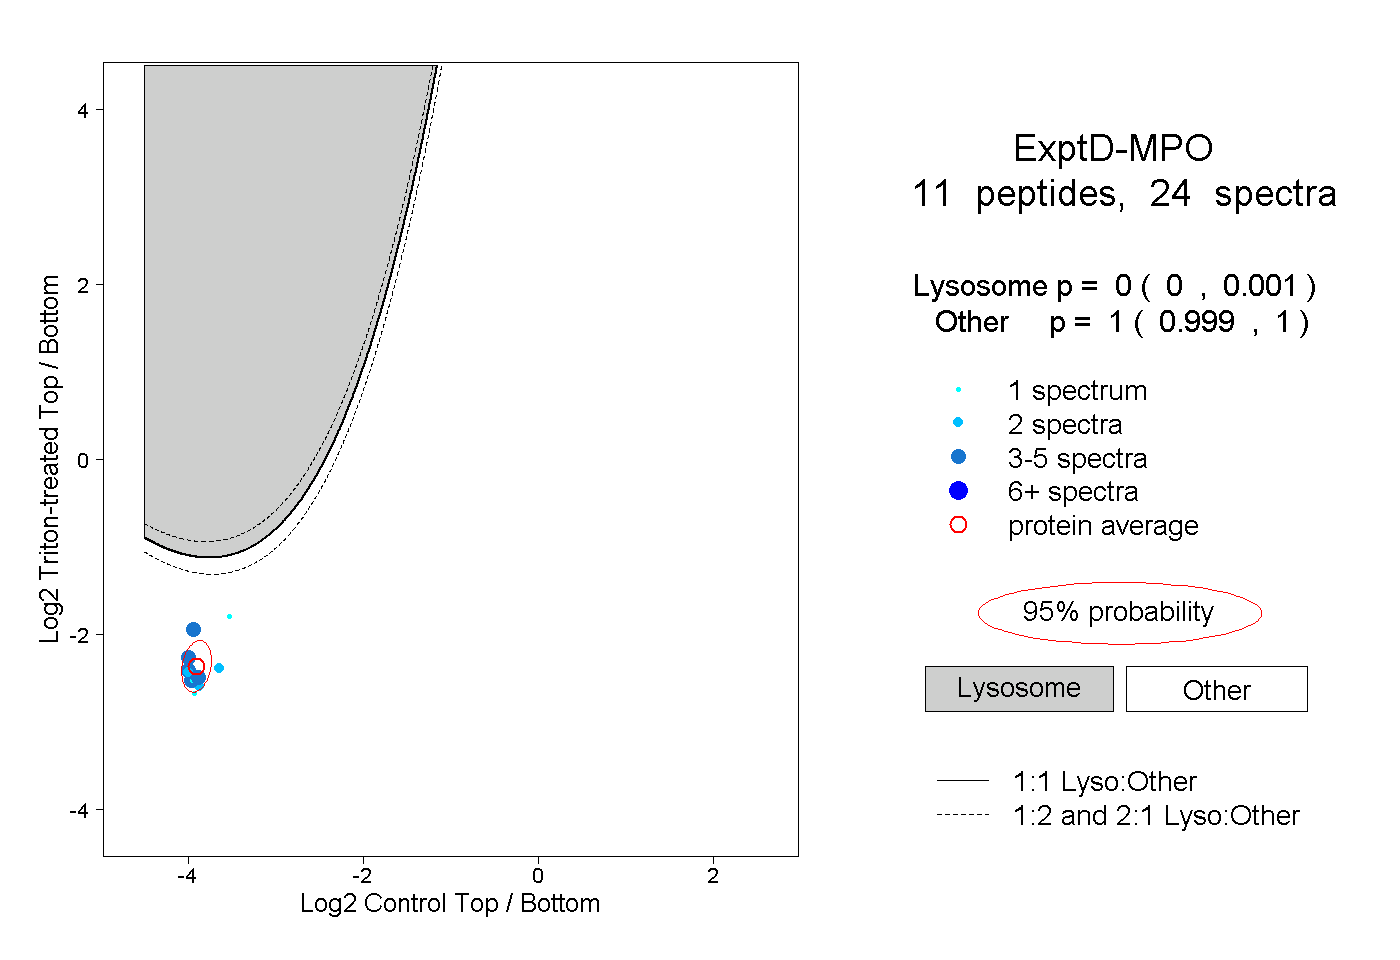 |
0.000 0.000 | 0.001 |
1.000 0.999 | 1.000 |