 6
6peptides
spectra
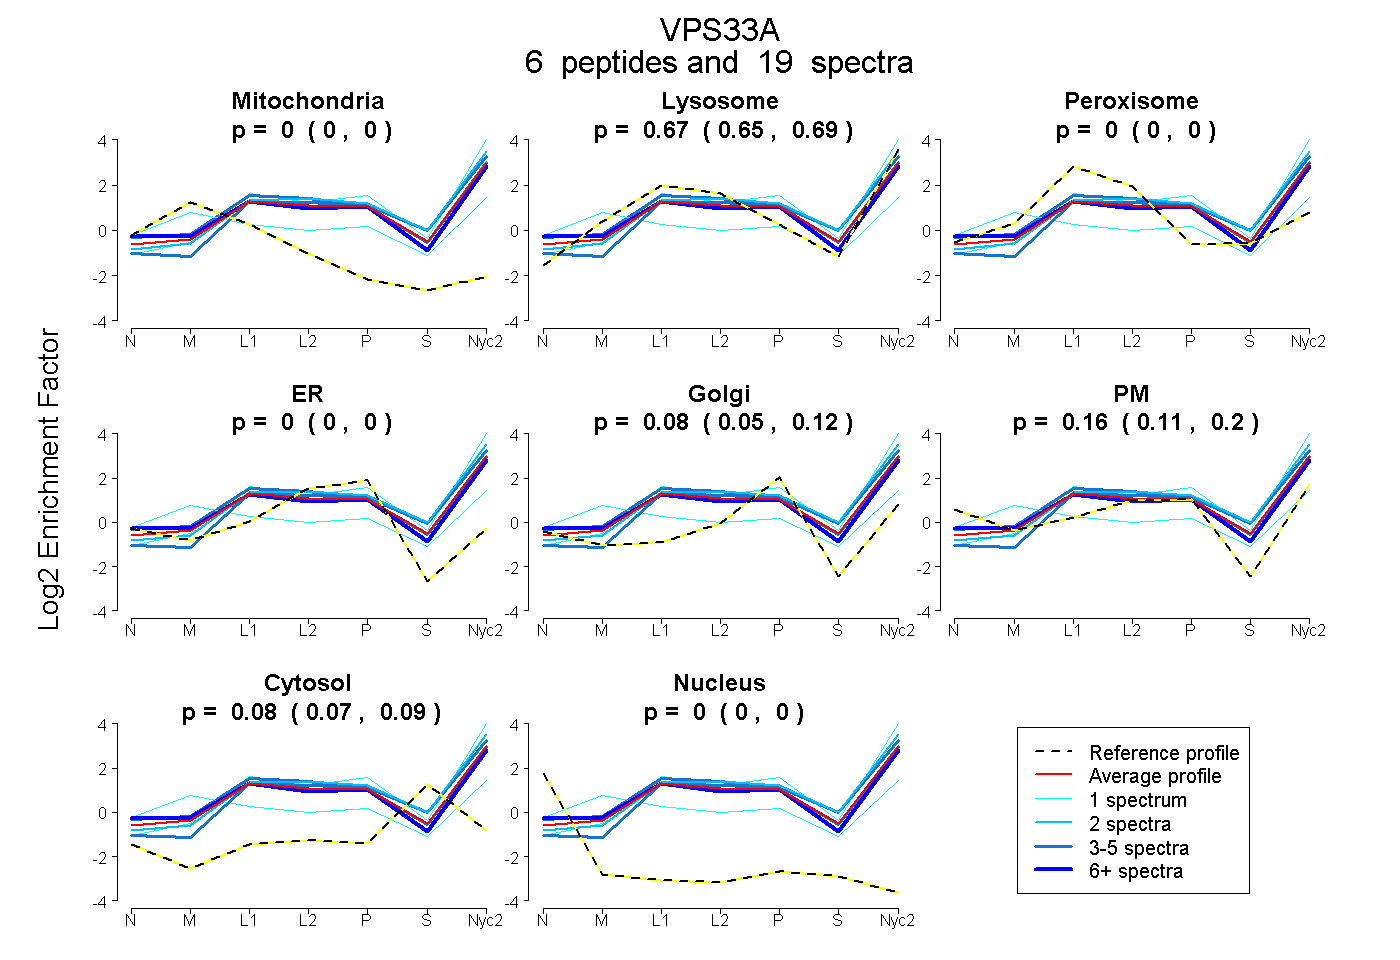
0.000 | 0.000
0.649 | 0.690
0.000 | 0.000
0.000 | 0.000
0.047 | 0.115
0.113 | 0.198
0.071 | 0.095
0.000 | 0.000
2peptides
spectra
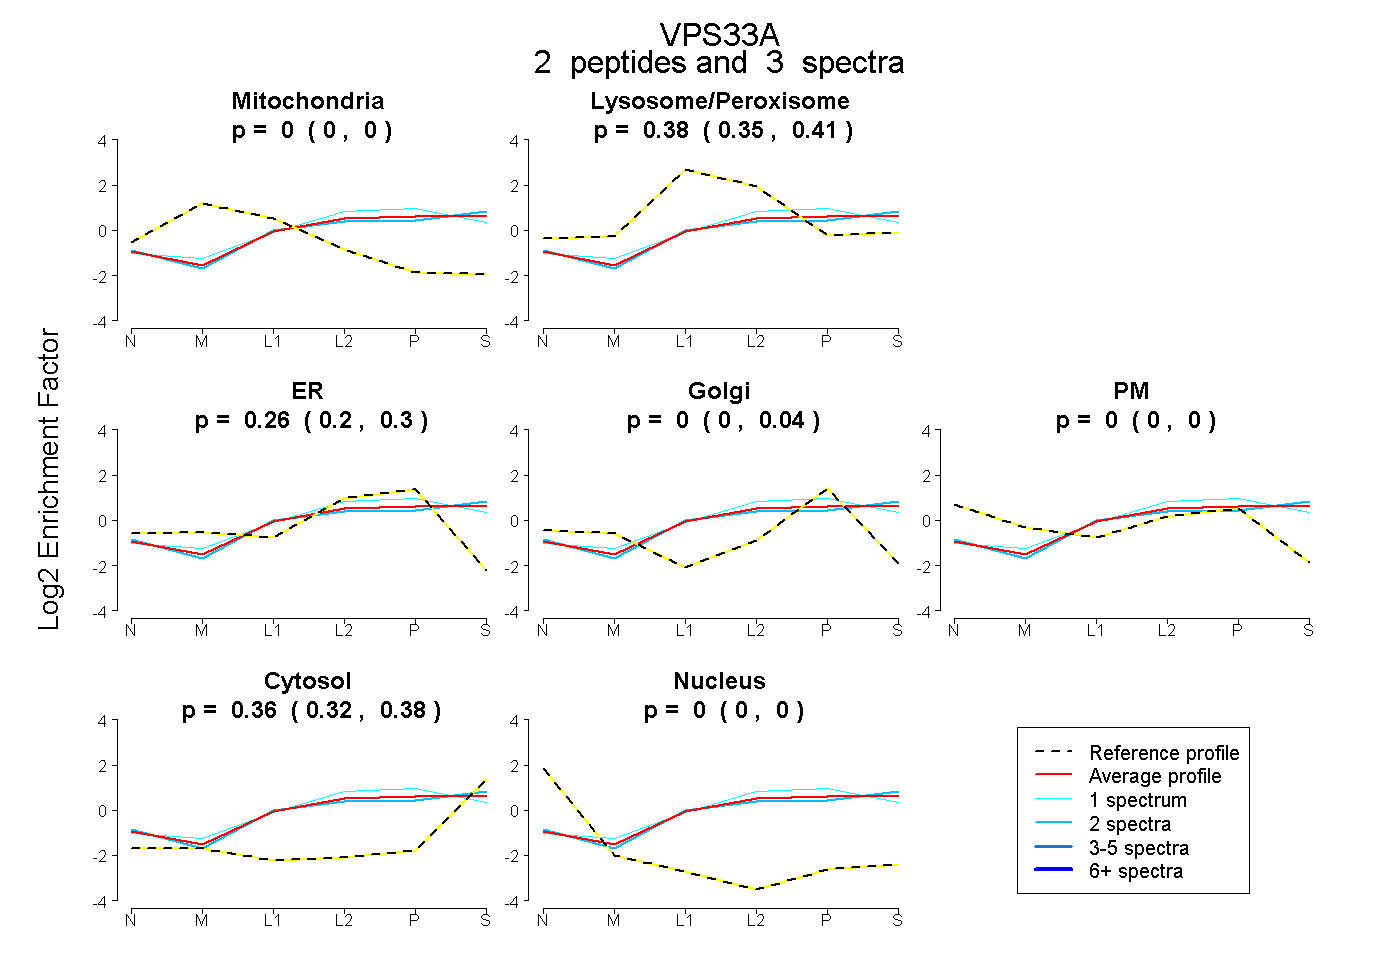
0.000 | 0.000
0.354 | 0.407
0.200 | 0.301
0.000 | 0.039
0.000 | 0.000
0.324 | 0.379
0.000 | 0.000
12peptides
spectra
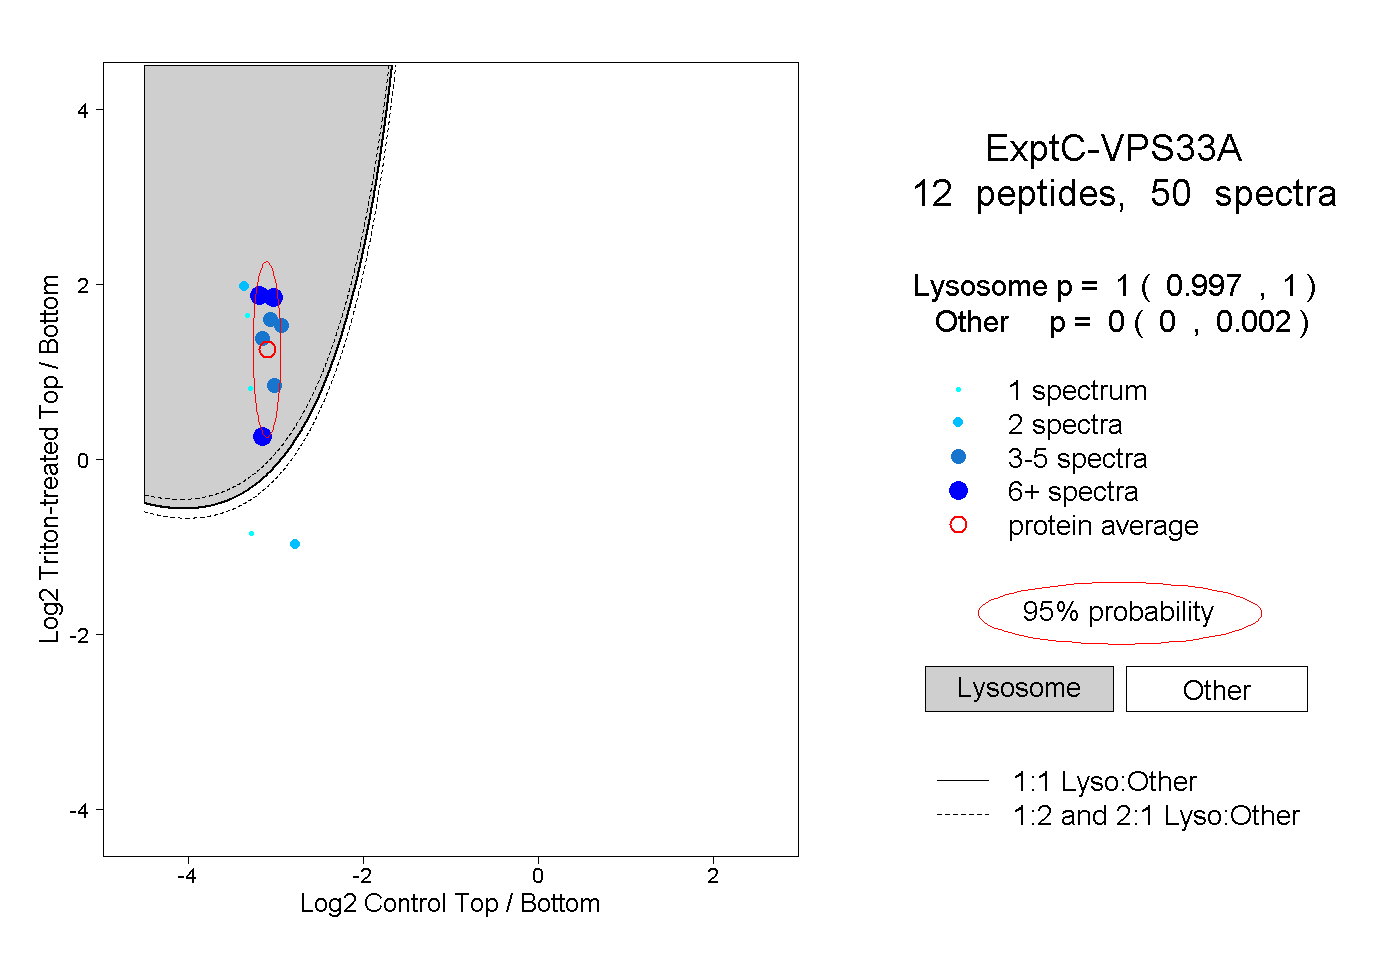
0.997 | 1.000
0.000 | 0.002
2peptides
spectra
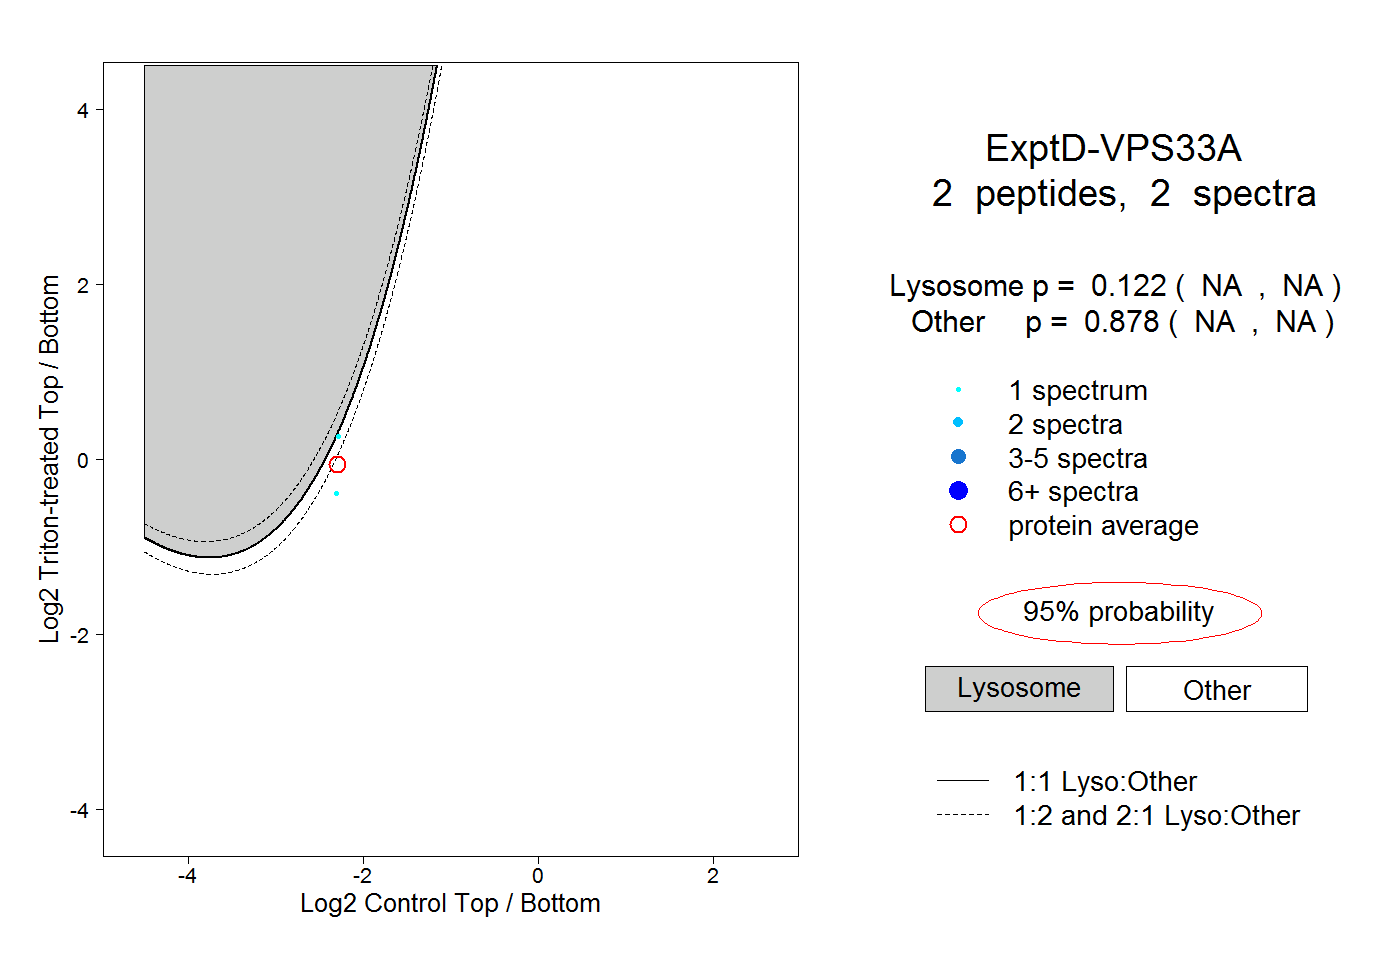
NA | NA
NA | NA