 6
6peptides
spectra
0.000 | 0.000
0.649 | 0.690
0.000 | 0.000
0.000 | 0.000
0.047 | 0.115
0.113 | 0.198
0.071 | 0.095
0.000 | 0.000
| Plot | Mito | Lyso | Perox | ER | Golgi | PM | Cytosol | Nucleus | |||||
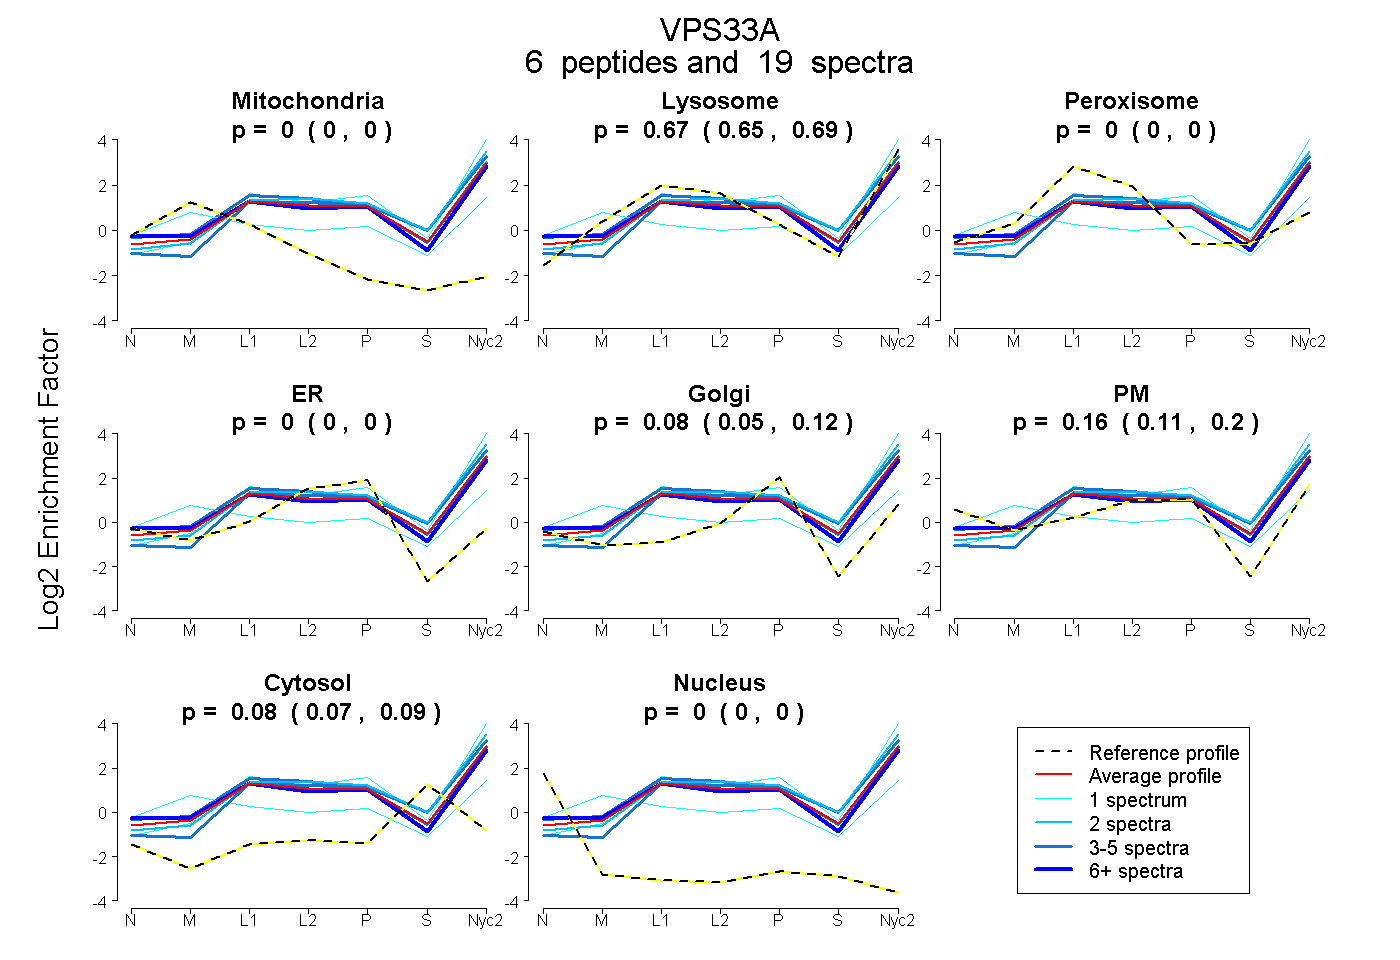
| Expt A |
6 peptides |
19 spectra |
|
0.000 0.000 | 0.000 |
0.672 0.649 | 0.690 |
0.000 0.000 | 0.000 |
0.000 0.000 | 0.000 |
0.085 0.047 | 0.115 |
0.160 0.113 | 0.198 |
0.084 0.071 | 0.095 |
0.000 0.000 | 0.000 |
| 3 spectra, IISAAFEER | 0.000 | 0.631 | 0.044 | 0.000 | 0.000 | 0.287 | 0.039 | 0.000 | ||
| 9 spectra, QFVSQLPHMQAAR | 0.000 | 0.550 | 0.000 | 0.000 | 0.007 | 0.382 | 0.061 | 0.000 | ||
| 2 spectra, VNNYIEDCIAQK | 0.000 | 0.817 | 0.000 | 0.000 | 0.101 | 0.000 | 0.082 | 0.000 | ||
| 1 spectrum, DVTTSEDFFDK | 0.000 | 0.863 | 0.000 | 0.000 | 0.137 | 0.000 | 0.000 | 0.000 | ||
| 3 spectra, SIEEVLR | 0.000 | 0.756 | 0.000 | 0.000 | 0.098 | 0.000 | 0.146 | 0.000 | ||
| 1 spectrum, ILPGPHFEER | 0.218 | 0.339 | 0.000 | 0.000 | 0.068 | 0.273 | 0.102 | 0.000 |
| Plot | Mito | Lyso or Perox | ER | Golgi | PM | Cytosol | Nucleus | ||||||
| Expt B |
2 peptides |
3 spectra |
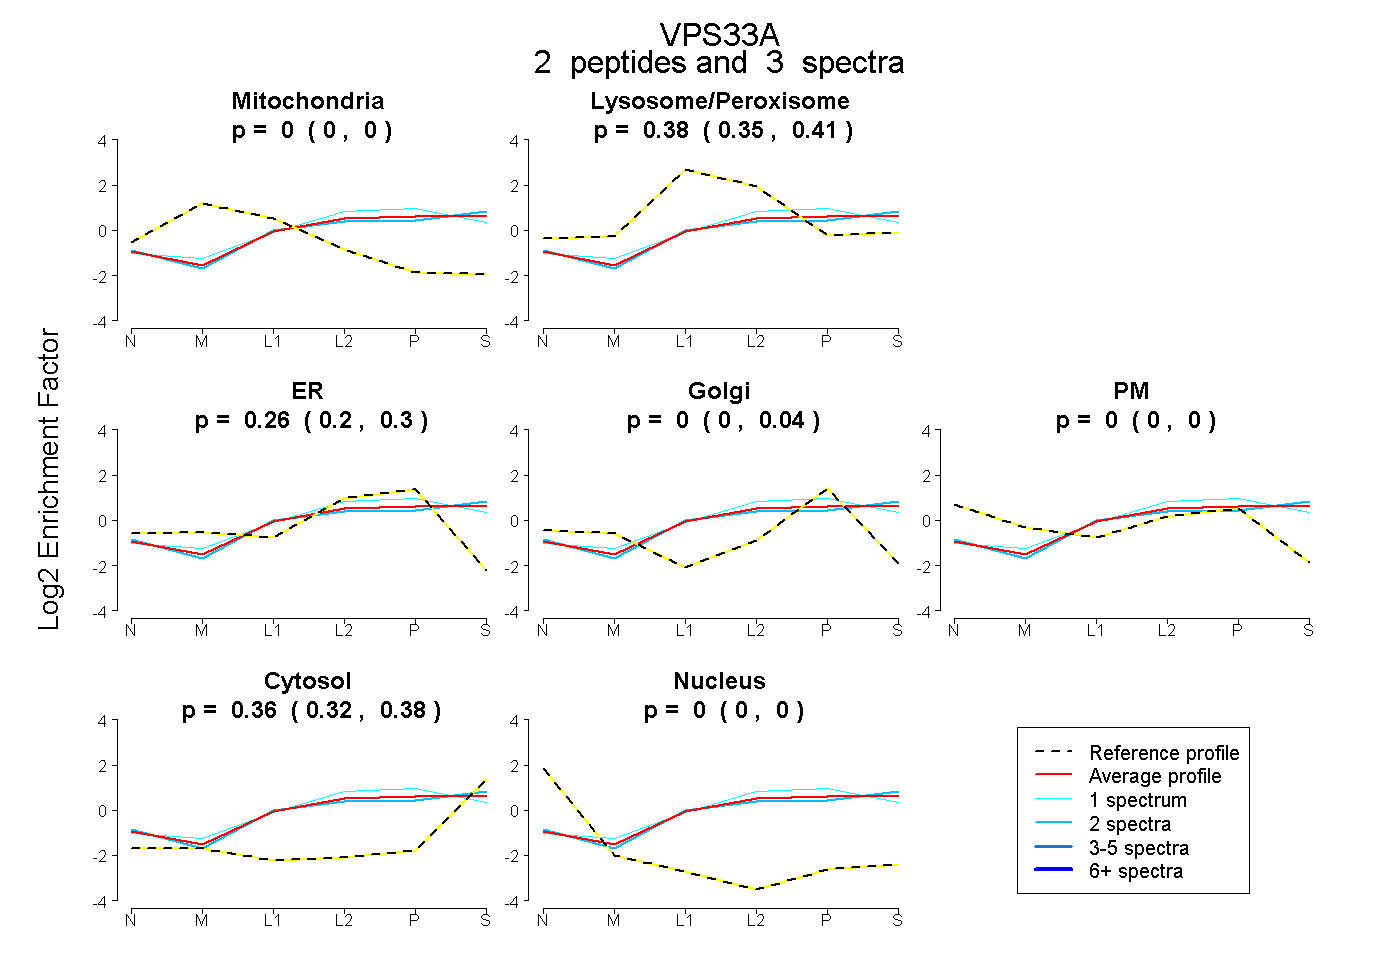 |
0.000 0.000 | 0.000 |
0.380 0.354 | 0.407 |
0.264 0.200 | 0.301 |
0.000 0.000 | 0.039 |
0.000 0.000 | 0.000 |
0.355 0.324 | 0.379 |
0.000 0.000 | 0.000 |
|||
| Plot | Lyso | Other | |||||||||||
| Expt C |
12 peptides |
50 spectra |
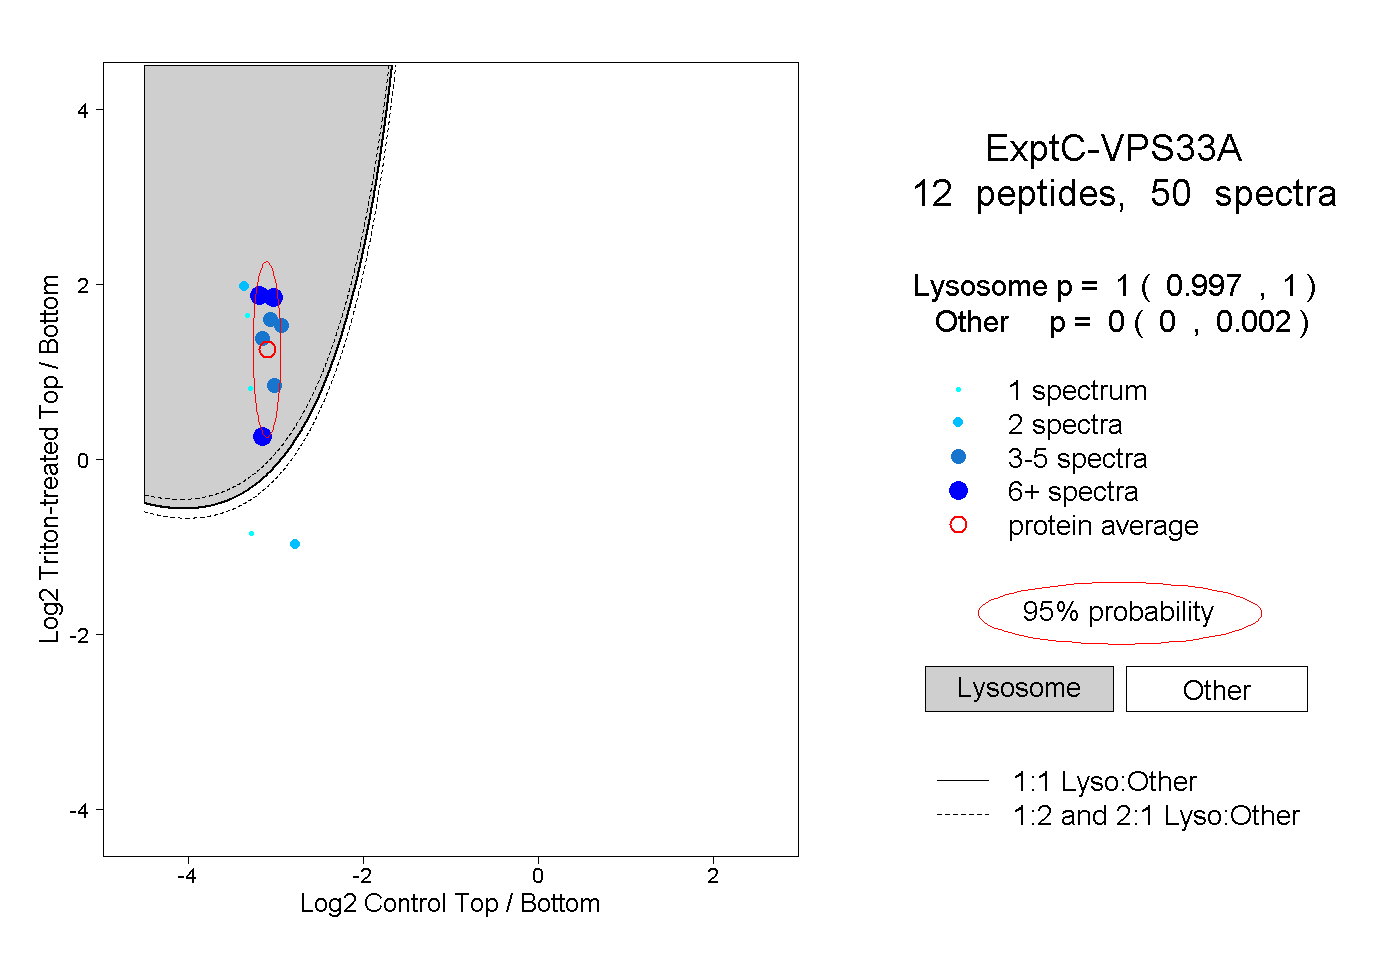 |
1.000 0.997 | 1.000 |
0.000 0.000 | 0.002 |
||||||||
| Plot | Lyso | Other | |||||||||||
| Expt D |
2 peptides |
2 spectra |
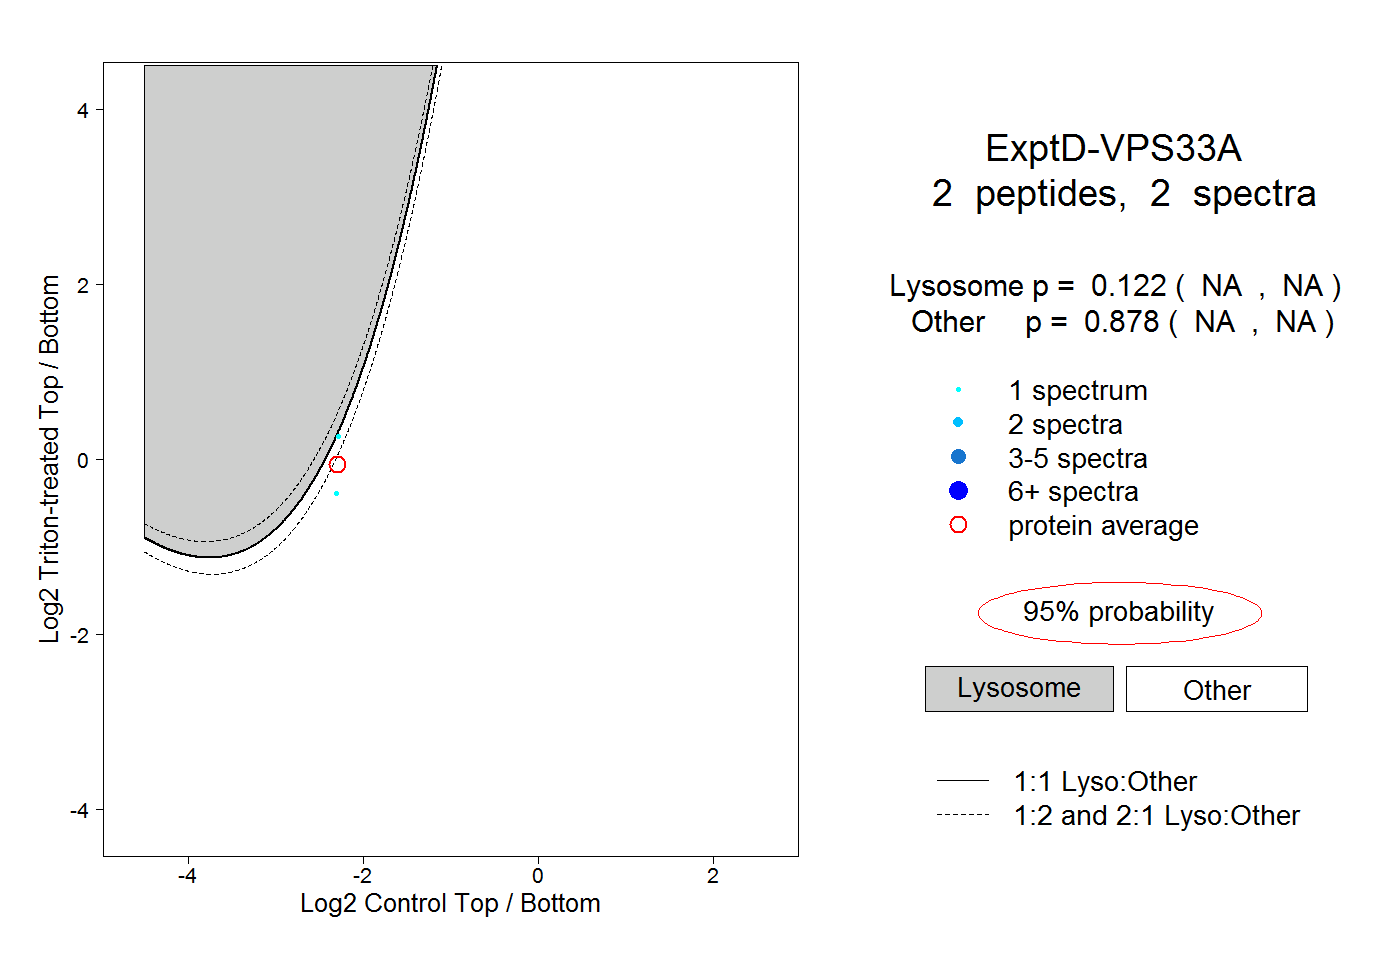 |
0.122 NA | NA |
0.878 NA | NA |