 3
3peptides
spectra
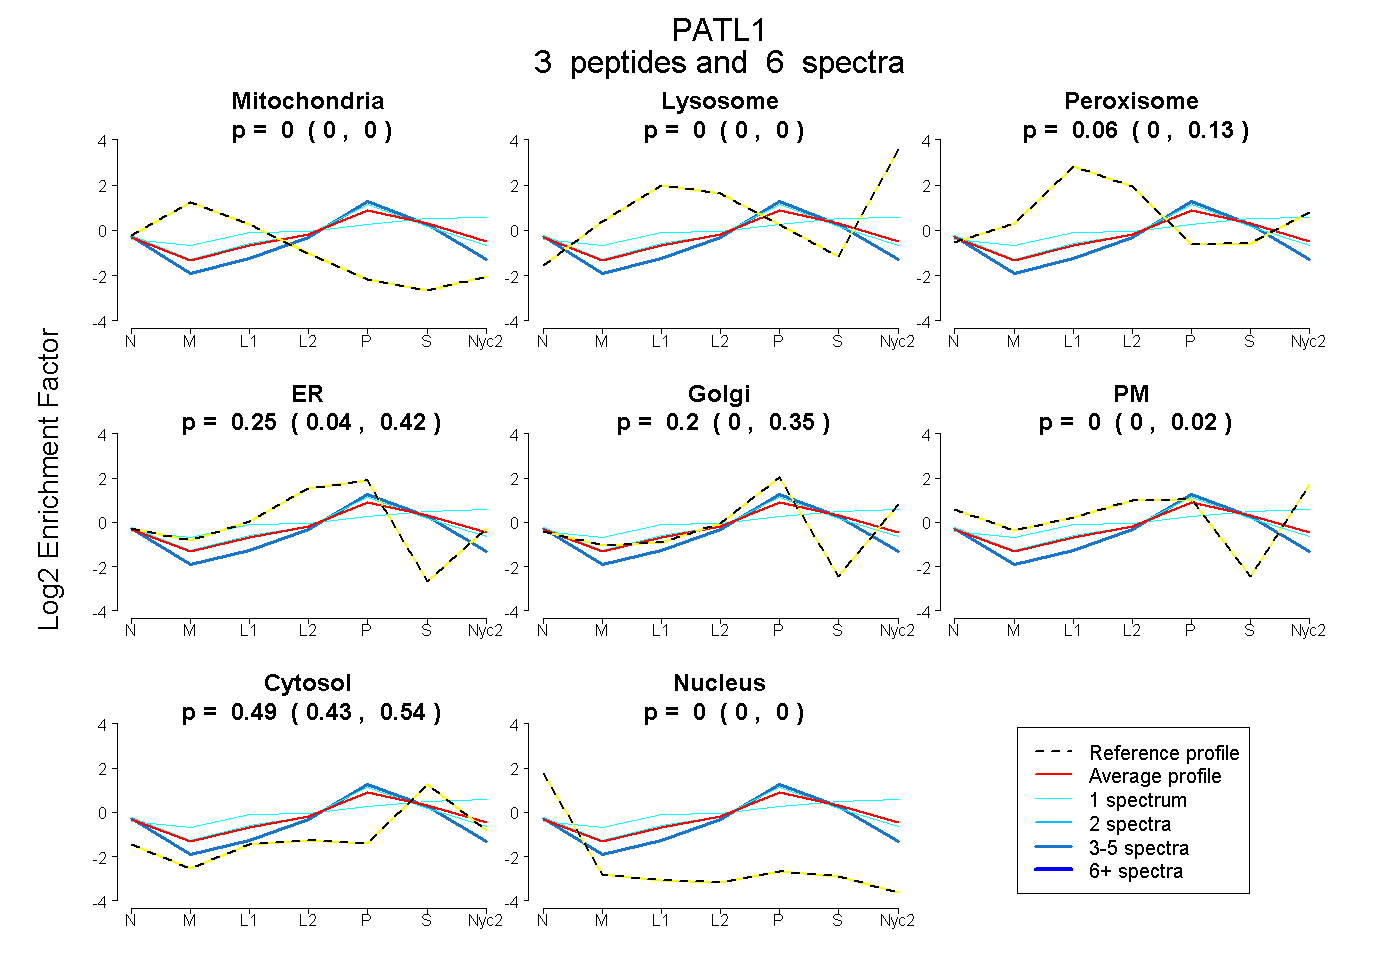
0.000 | 0.000
0.000 | 0.000
0.000 | 0.131
0.036 | 0.419
0.004 | 0.353
0.000 | 0.019
0.434 | 0.541
0.000 | 0.000
2peptides
spectra
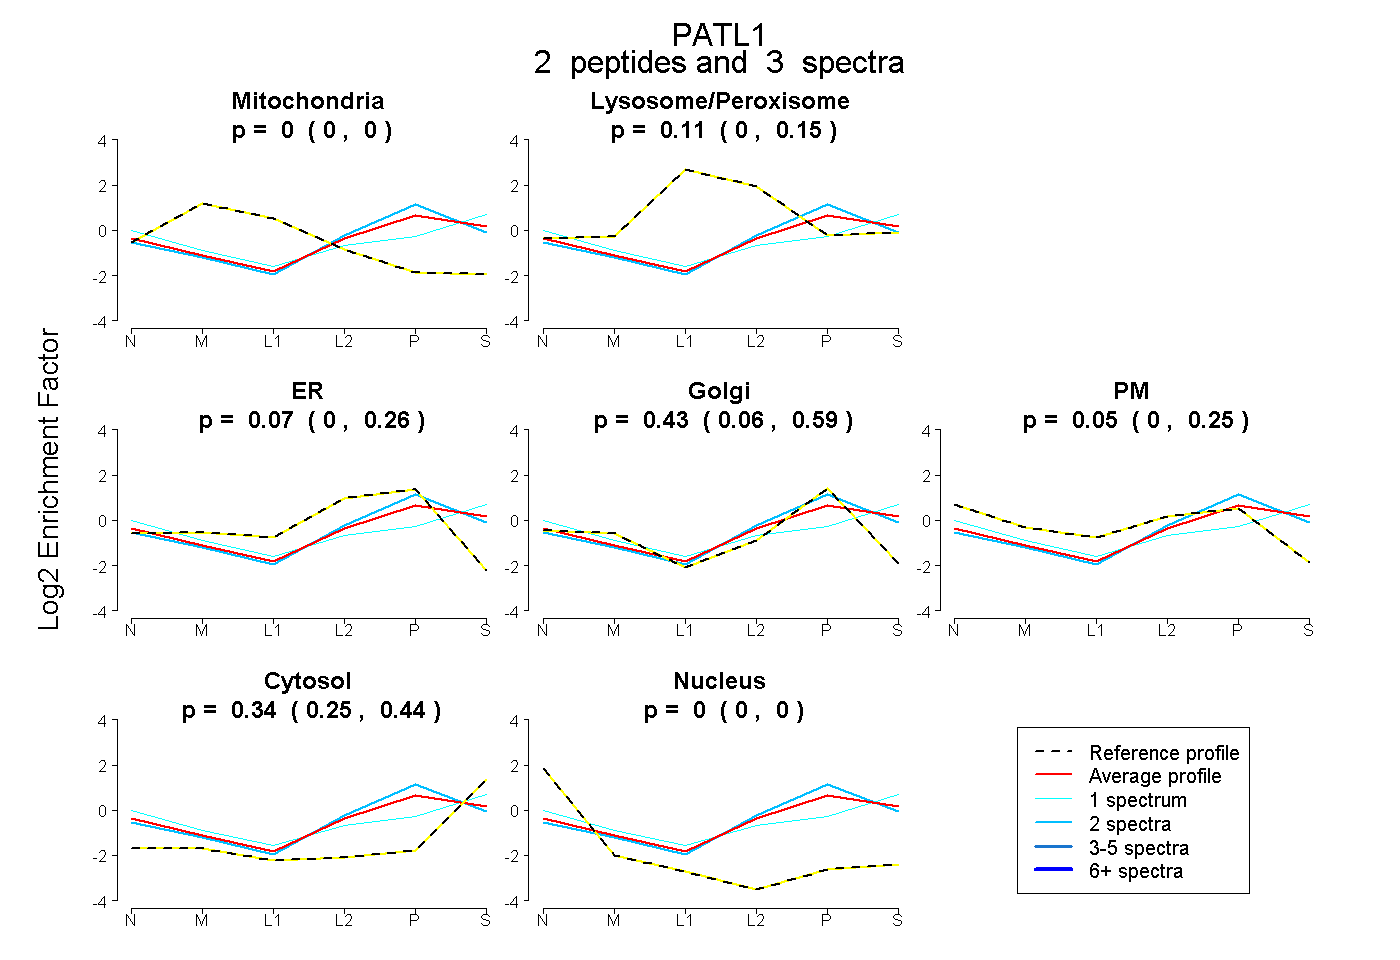
0.000 | 0.000
0.000 | 0.154
0.000 | 0.257
0.064 | 0.587
0.000 | 0.253
0.248 | 0.437
0.000 | 0.000
4peptides
spectra
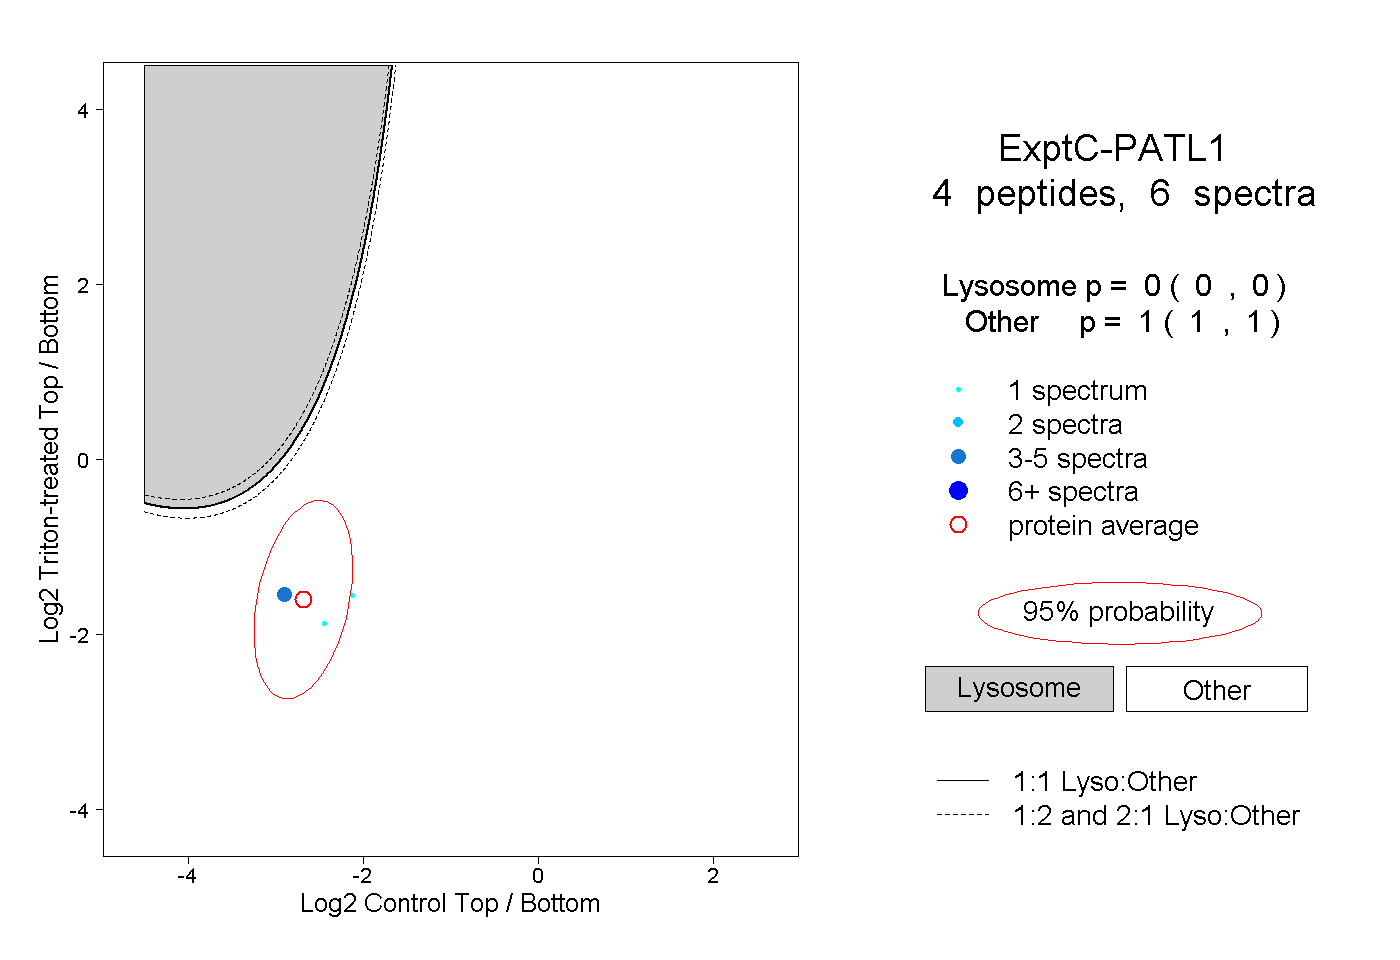
0.000 | 0.000
1.000 | 1.000