 3
3peptides
spectra
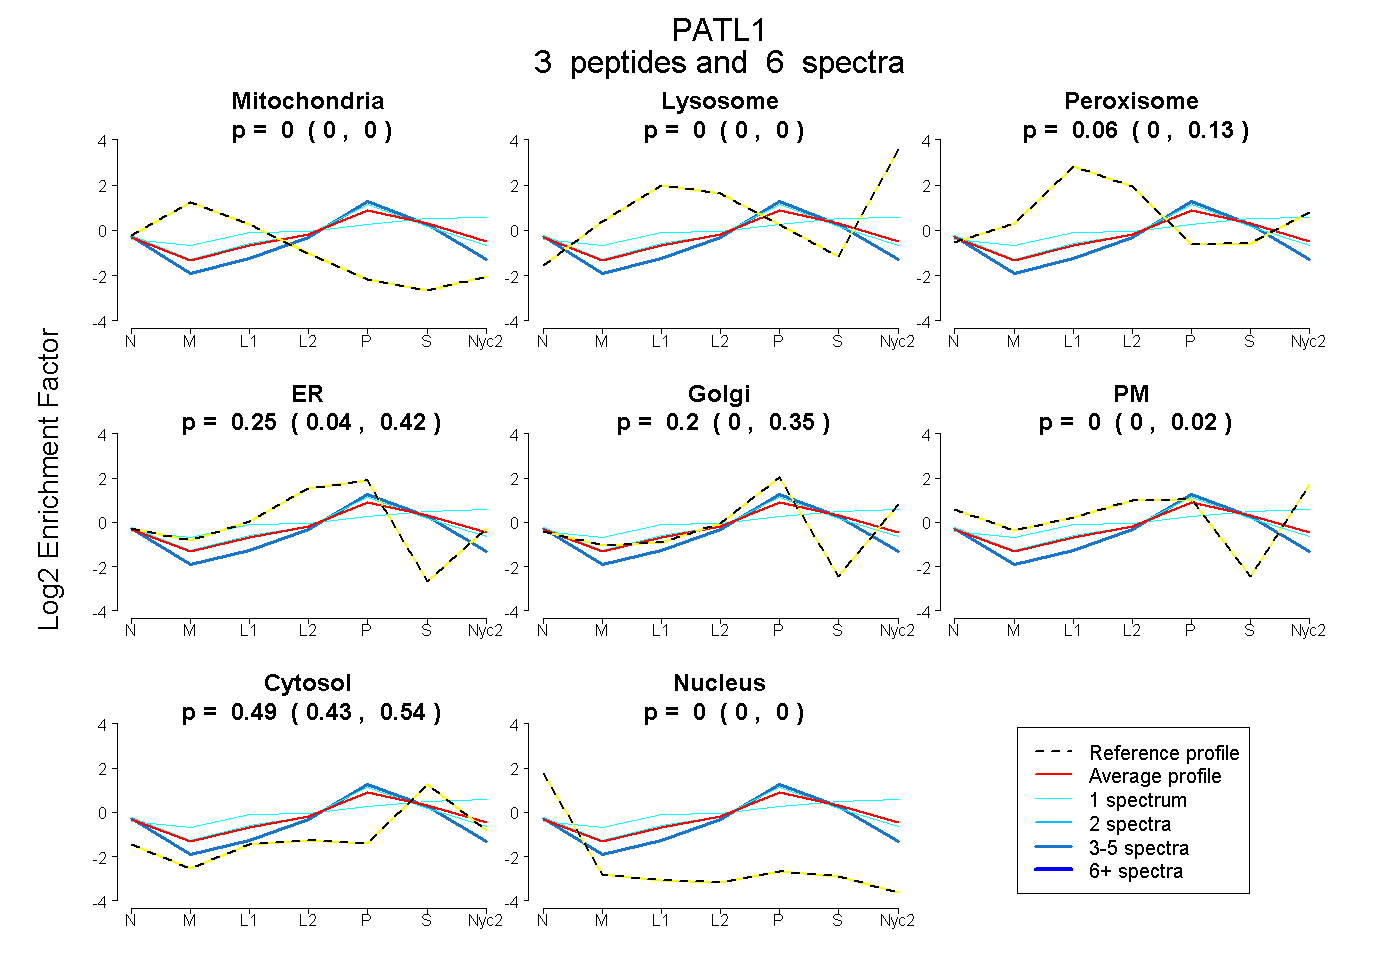
0.000 | 0.000
0.000 | 0.000
0.000 | 0.131
0.036 | 0.419
0.004 | 0.353
0.000 | 0.019
0.434 | 0.541
0.000 | 0.000
| Plot | Mito | Lyso | Perox | ER | Golgi | PM | Cytosol | Nucleus | |||||
| Expt A |
3 peptides |
6 spectra |
|
0.000 0.000 | 0.000 |
0.000 0.000 | 0.000 |
0.062 0.000 | 0.131 |
0.251 0.036 | 0.419 |
0.197 0.004 | 0.353 |
0.000 0.000 | 0.019 |
0.491 0.434 | 0.541 |
0.000 0.000 | 0.000 |
| 4 spectra, LITPQVAR | 0.000 | 0.000 | 0.000 | 0.356 | 0.090 | 0.000 | 0.534 | 0.020 | ||
| 1 spectrum, MVIENELEDPAVMR | 0.000 | 0.099 | 0.187 | 0.000 | 0.122 | 0.149 | 0.442 | 0.000 | ||
| 1 spectrum, LTVSSVNNPR | 0.000 | 0.000 | 0.025 | 0.360 | 0.147 | 0.000 | 0.468 | 0.000 |
| Plot | Mito | Lyso or Perox | ER | Golgi | PM | Cytosol | Nucleus | ||||||
| Expt B |
2 peptides |
3 spectra |
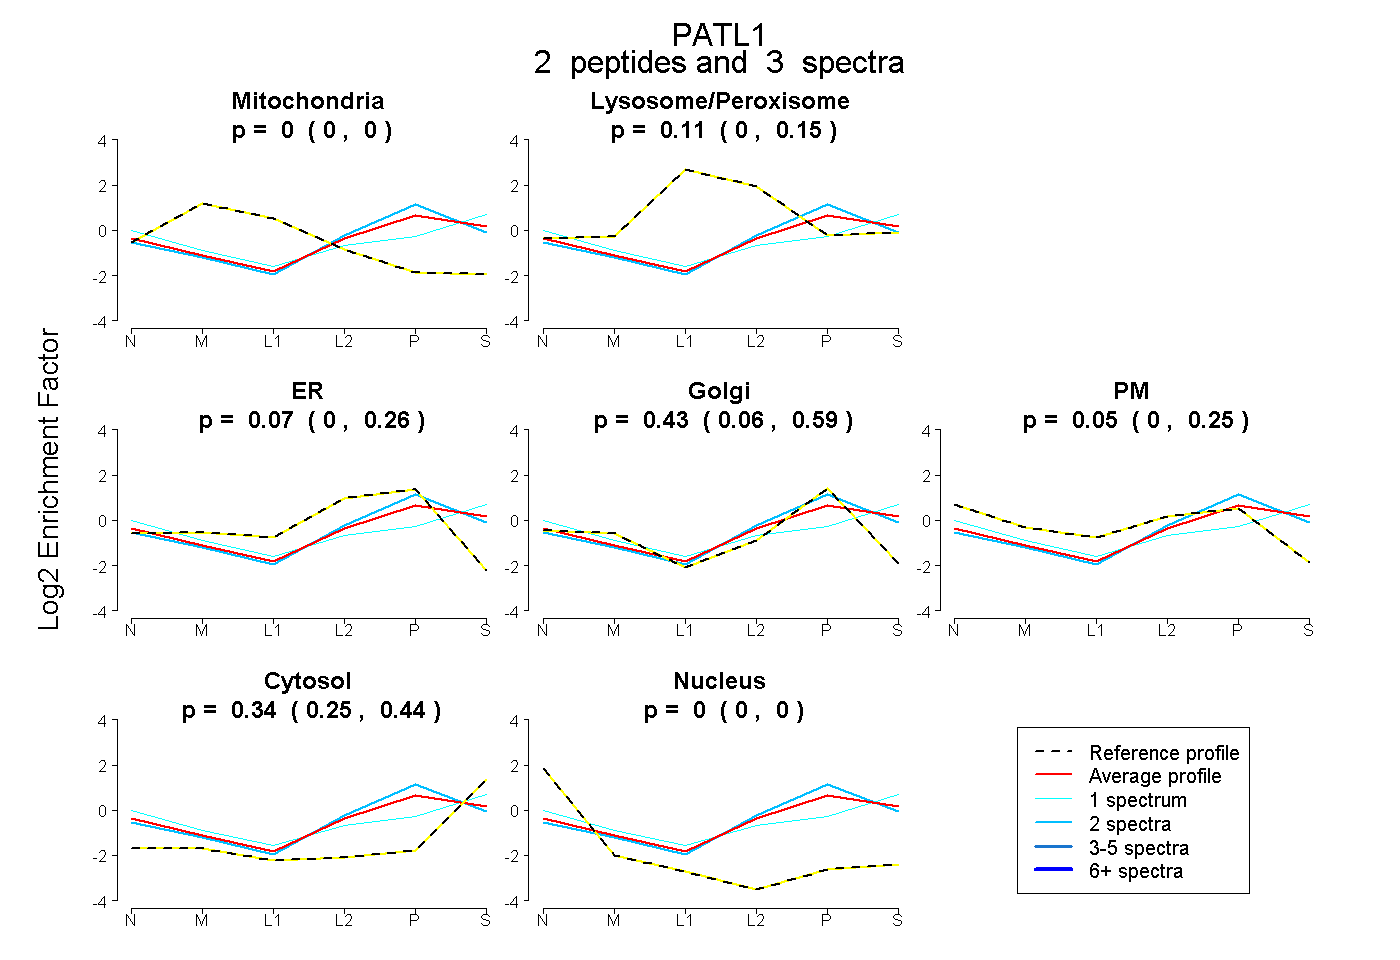 |
0.000 0.000 | 0.000 |
0.108 0.000 | 0.154 |
0.074 0.000 | 0.257 |
0.433 0.064 | 0.587 |
0.045 0.000 | 0.253 |
0.340 0.248 | 0.437 |
0.000 0.000 | 0.000 |
|||
| Plot | Lyso | Other | |||||||||||
| Expt C |
4 peptides |
6 spectra |
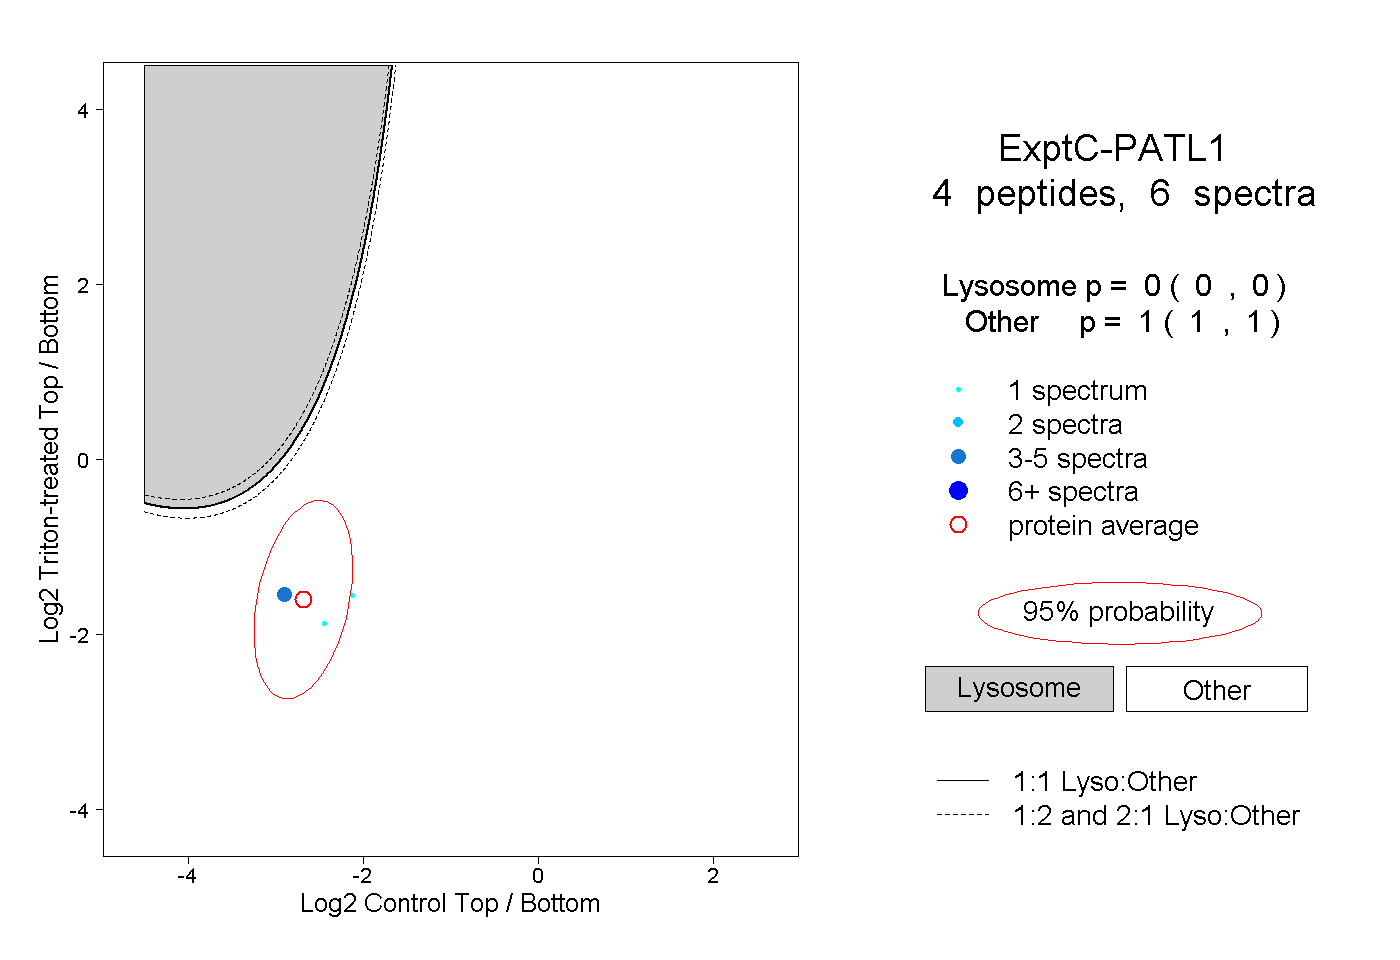 |
0.000 0.000 | 0.000 |
1.000 1.000 | 1.000 |