 14
14peptides
spectra
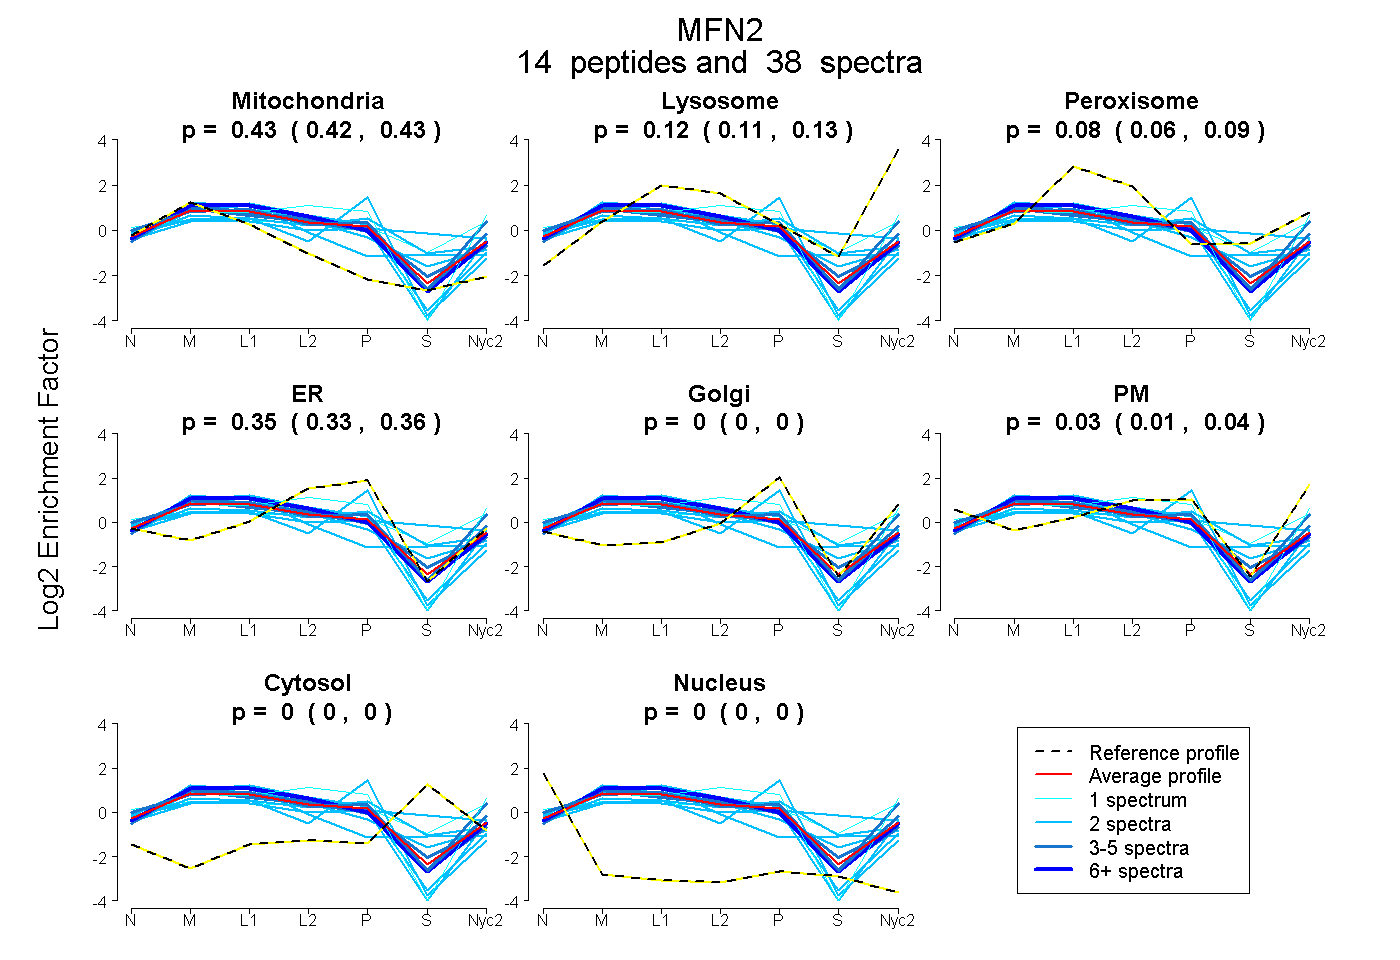
0.417 | 0.433
0.111 | 0.133
0.056 | 0.093
0.330 | 0.362
0.000 | 0.000
0.013 | 0.039
0.000 | 0.000
0.000 | 0.000
8peptides
spectra
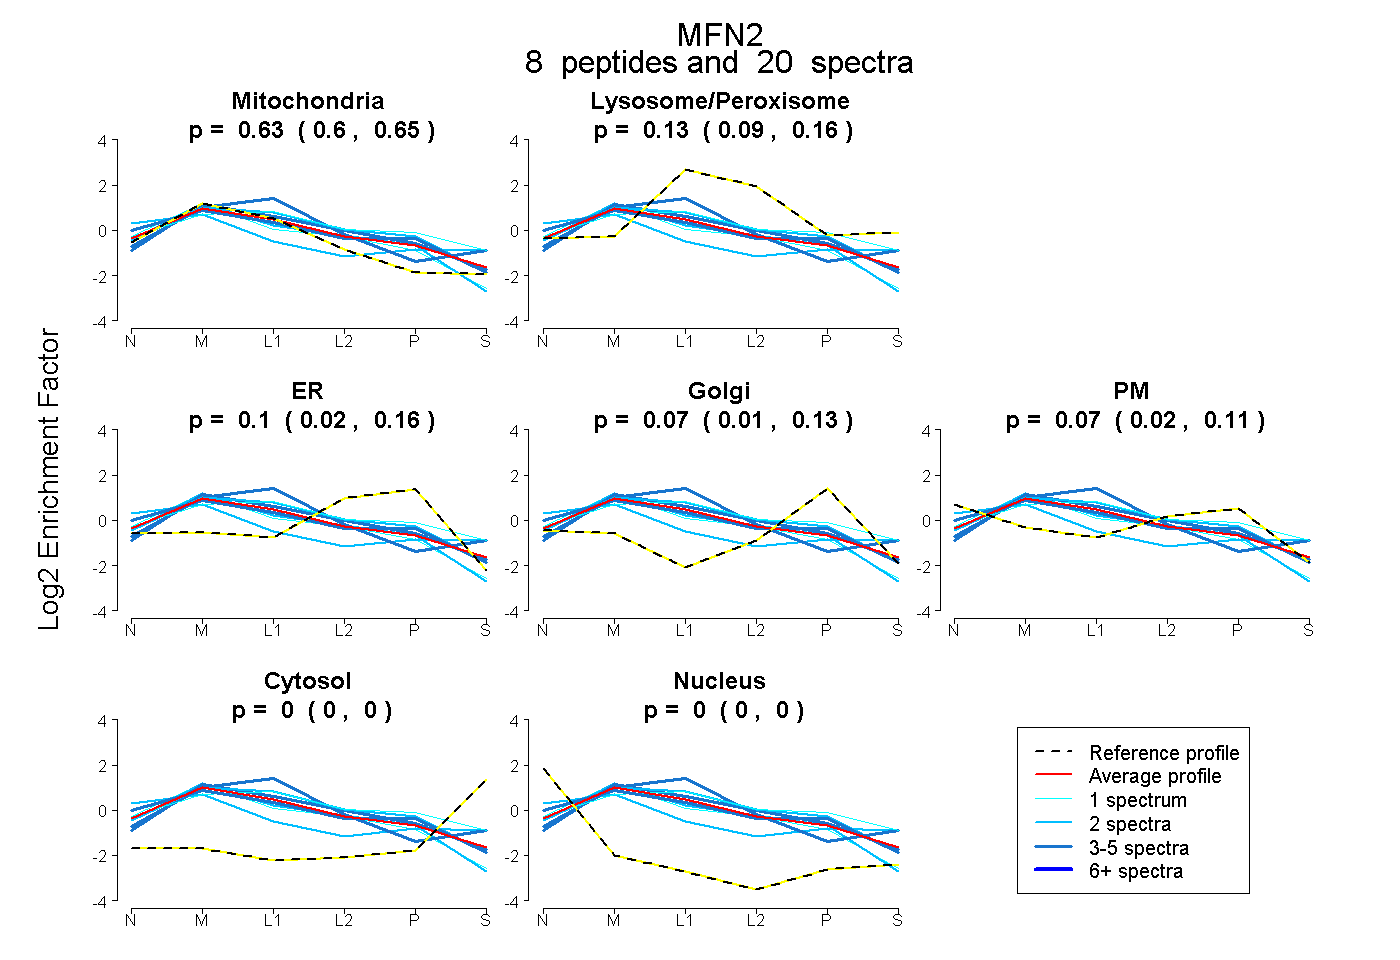
0.603 | 0.648
0.093 | 0.165
0.024 | 0.158
0.009 | 0.126
0.023 | 0.112
0.000 | 0.000
0.000 | 0.000
25peptides
spectra
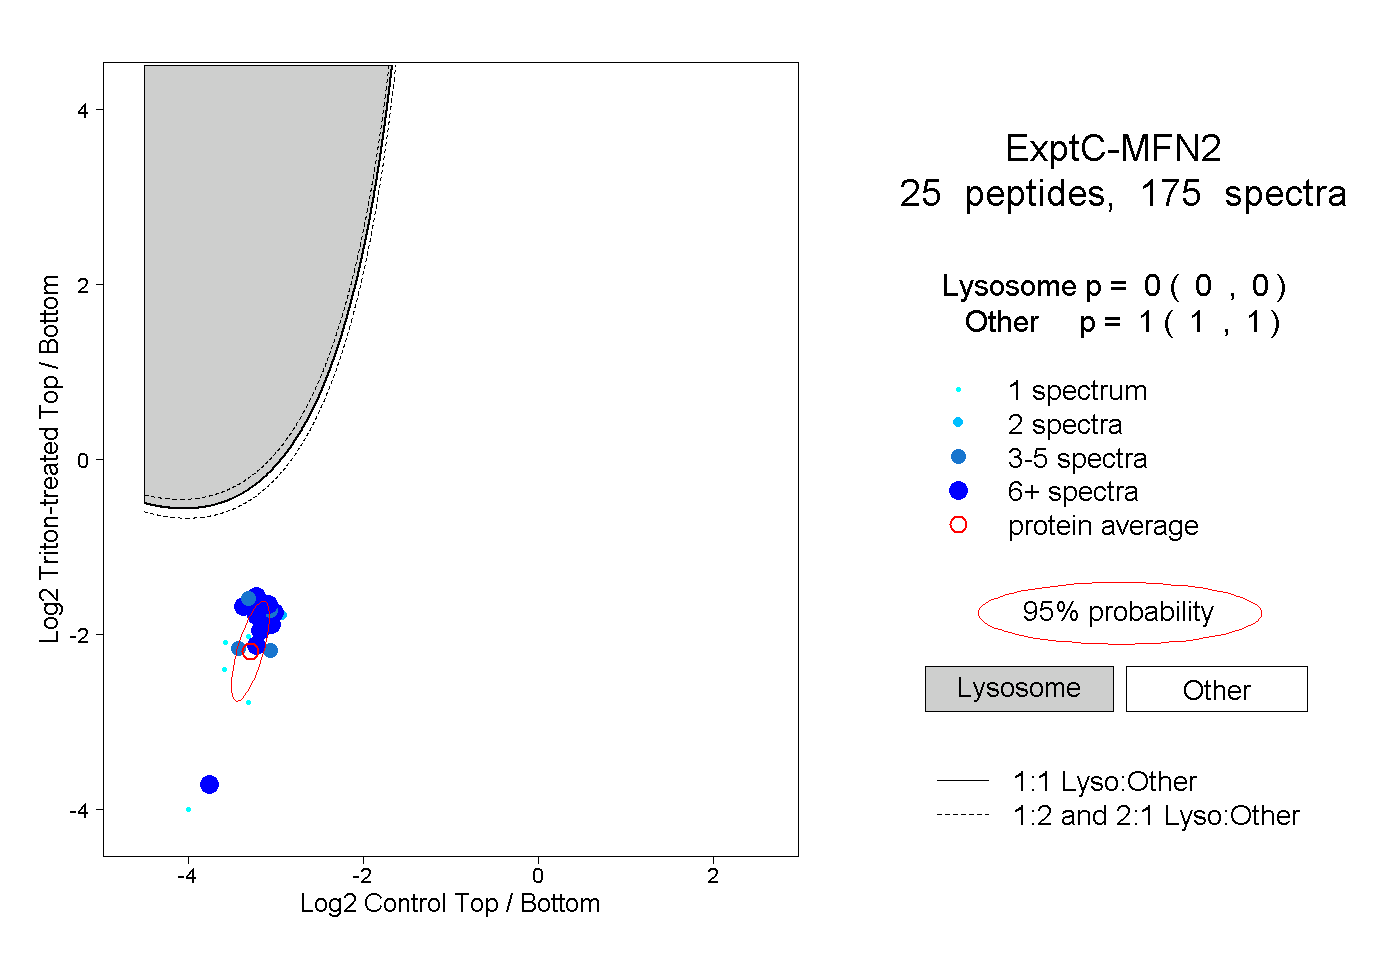
0.000 | 0.000
1.000 | 1.000
6peptides
spectra
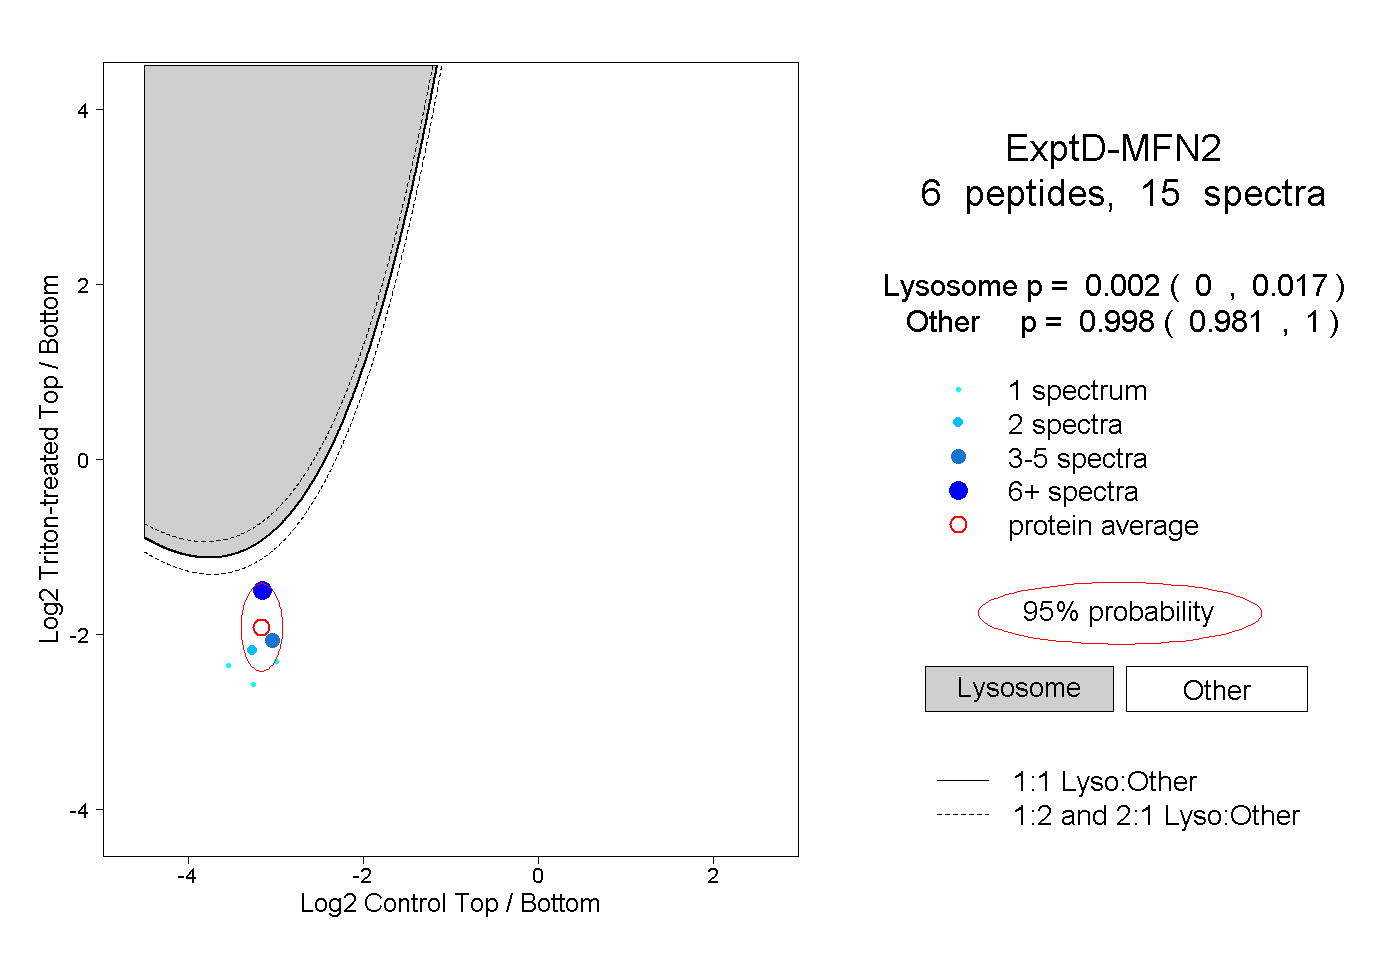
0.000 | 0.017
0.981 | 1.000