 14
14peptides
spectra
0.417 | 0.433
0.111 | 0.133
0.056 | 0.093
0.330 | 0.362
0.000 | 0.000
0.013 | 0.039
0.000 | 0.000
0.000 | 0.000
| Plot | Mito | Lyso | Perox | ER | Golgi | PM | Cytosol | Nucleus | |||||
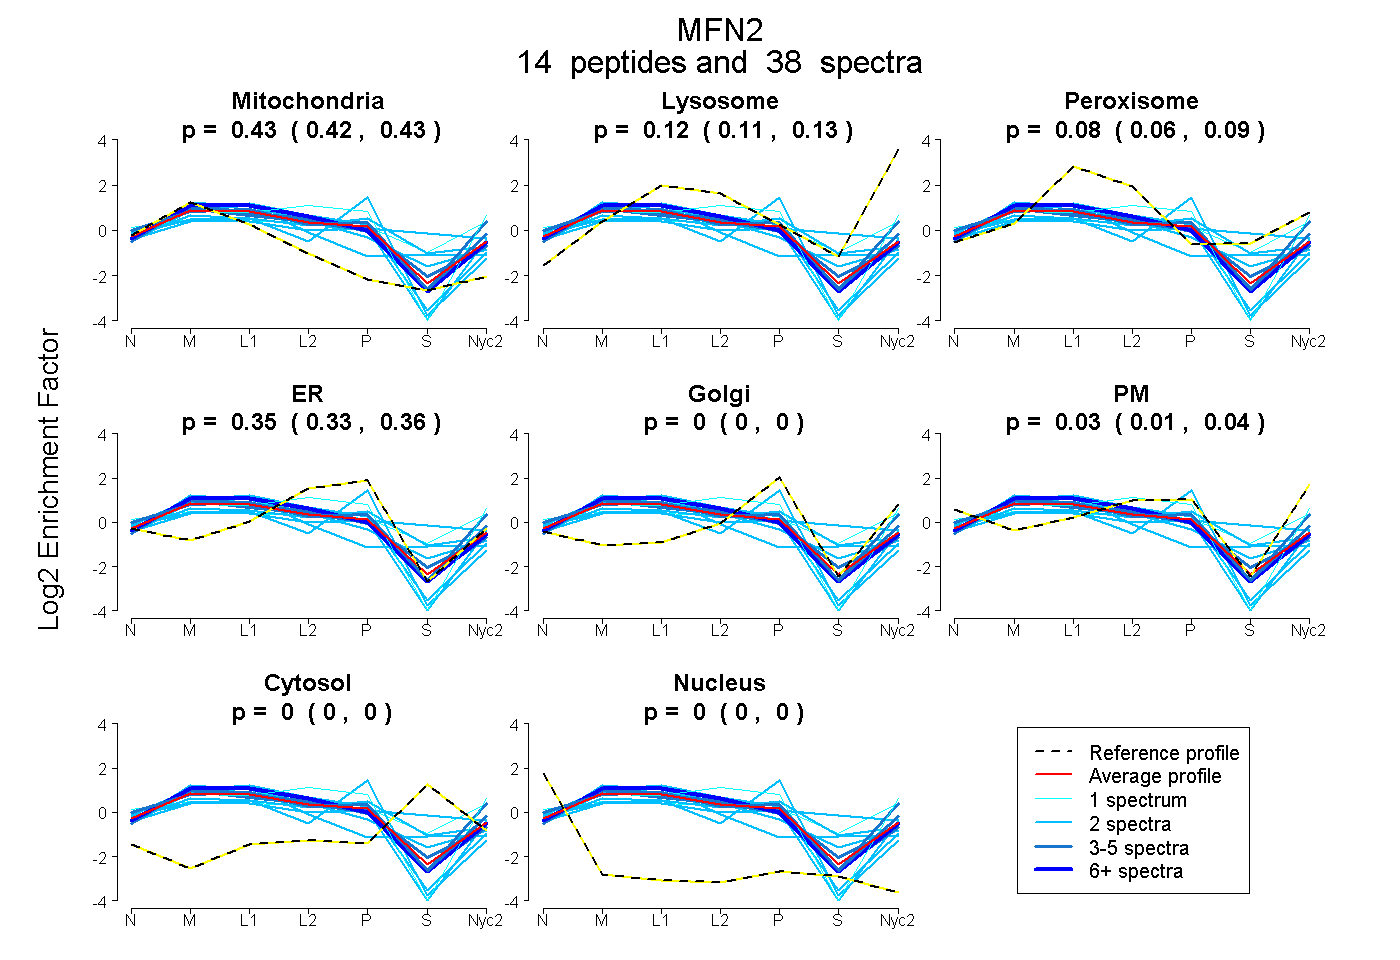
| Expt A |
14 peptides |
38 spectra |
|
0.426 0.417 | 0.433 |
0.123 0.111 | 0.133 |
0.076 0.056 | 0.093 |
0.347 0.330 | 0.362 |
0.000 0.000 | 0.000 |
0.028 0.013 | 0.039 |
0.000 0.000 | 0.000 |
0.000 0.000 | 0.000 |
| 6 spectra, QMTEEVER | 0.430 | 0.114 | 0.123 | 0.333 | 0.000 | 0.000 | 0.000 | 0.000 | ||
| 2 spectra, HIEEGLGR | 0.190 | 0.000 | 0.364 | 0.000 | 0.214 | 0.000 | 0.232 | 0.000 | ||
| 2 spectra, AQGMPEGGGALAEGFQVR | 0.427 | 0.000 | 0.348 | 0.199 | 0.025 | 0.000 | 0.000 | 0.000 | ||
| 4 spectra, NQIDMLVPR | 0.406 | 0.246 | 0.000 | 0.141 | 0.000 | 0.207 | 0.000 | 0.000 | ||
| 2 spectra, LIMDSLHIAAQEQR | 0.431 | 0.003 | 0.090 | 0.476 | 0.000 | 0.000 | 0.000 | 0.000 | ||
| 2 spectra, MFEFQNFER | 0.476 | 0.131 | 0.000 | 0.365 | 0.000 | 0.028 | 0.000 | 0.000 | ||
| 2 spectra, HFVTAK | 0.373 | 0.000 | 0.000 | 0.464 | 0.163 | 0.000 | 0.000 | 0.000 | ||
| 2 spectra, LLSFR | 0.537 | 0.000 | 0.386 | 0.000 | 0.000 | 0.000 | 0.077 | 0.000 | ||
| 3 spectra, QIAEAVR | 0.451 | 0.087 | 0.125 | 0.337 | 0.000 | 0.000 | 0.000 | 0.000 | ||
| 5 spectra, VAFFGR | 0.377 | 0.059 | 0.071 | 0.235 | 0.000 | 0.259 | 0.000 | 0.000 | ||
| 1 spectrum, DNLEQEIAAMNK | 0.188 | 0.000 | 0.249 | 0.000 | 0.080 | 0.364 | 0.118 | 0.000 | ||
| 2 spectra, FEQHTVR | 0.281 | 0.000 | 0.275 | 0.186 | 0.184 | 0.000 | 0.073 | 0.000 | ||
| 1 spectrum, QVSTAMAEEIR | 0.202 | 0.064 | 0.000 | 0.284 | 0.000 | 0.450 | 0.000 | 0.000 | ||
| 4 spectra, QLELLAQDYK | 0.466 | 0.128 | 0.051 | 0.354 | 0.000 | 0.000 | 0.000 | 0.000 |
| Plot | Mito | Lyso or Perox | ER | Golgi | PM | Cytosol | Nucleus | ||||||
| Expt B |
8 peptides |
20 spectra |
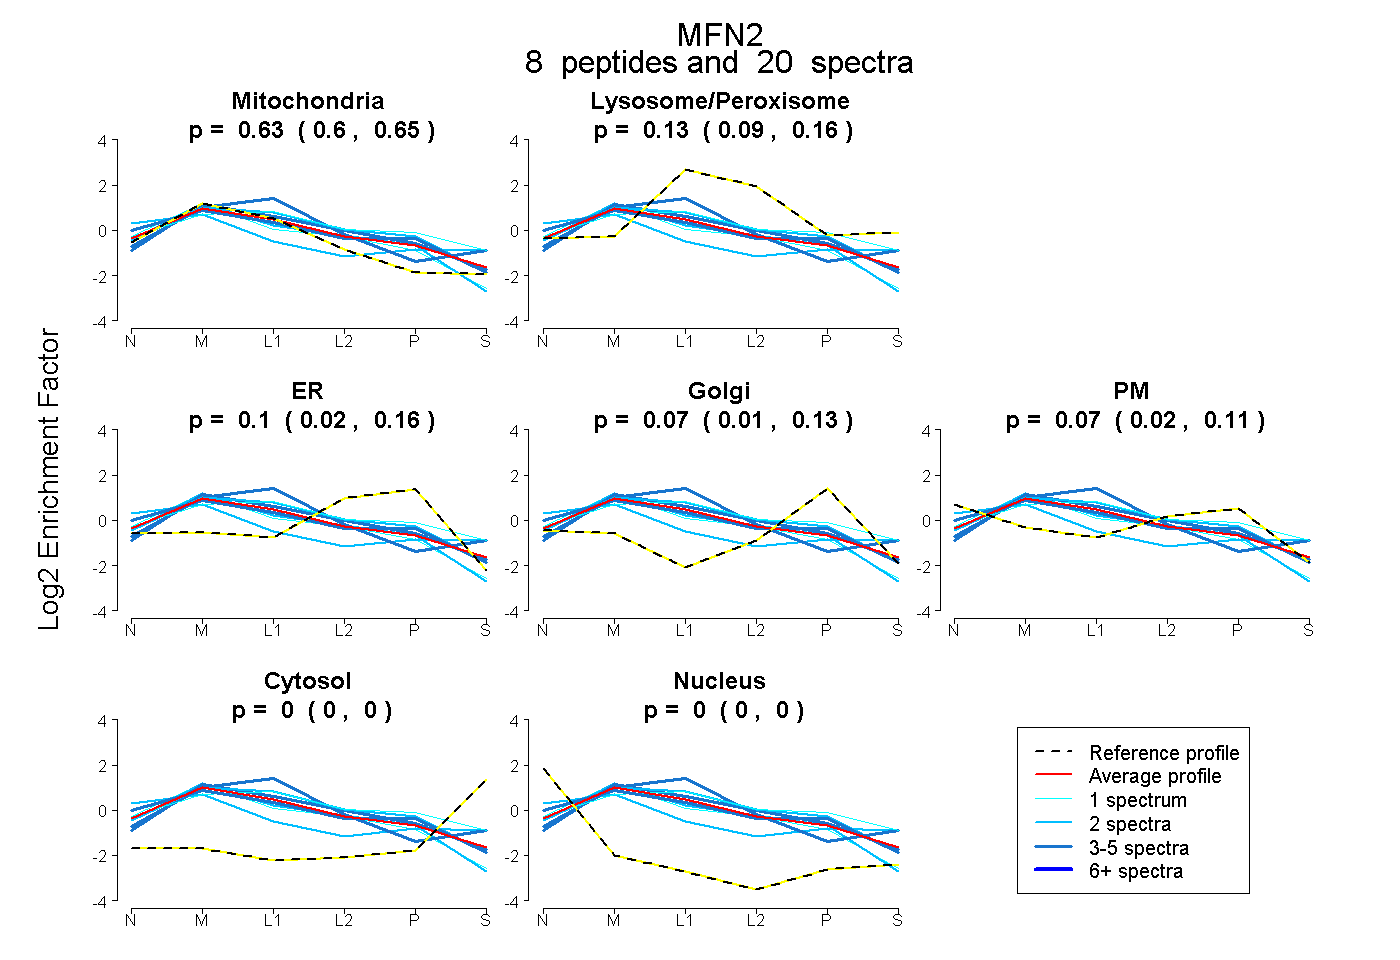 |
0.627 0.603 | 0.648 |
0.133 0.093 | 0.165 |
0.096 0.024 | 0.158 |
0.074 0.009 | 0.126 |
0.071 0.023 | 0.112 |
0.000 0.000 | 0.000 |
0.000 0.000 | 0.000 |
|||
| Plot | Lyso | Other | |||||||||||
| Expt C |
25 peptides |
175 spectra |
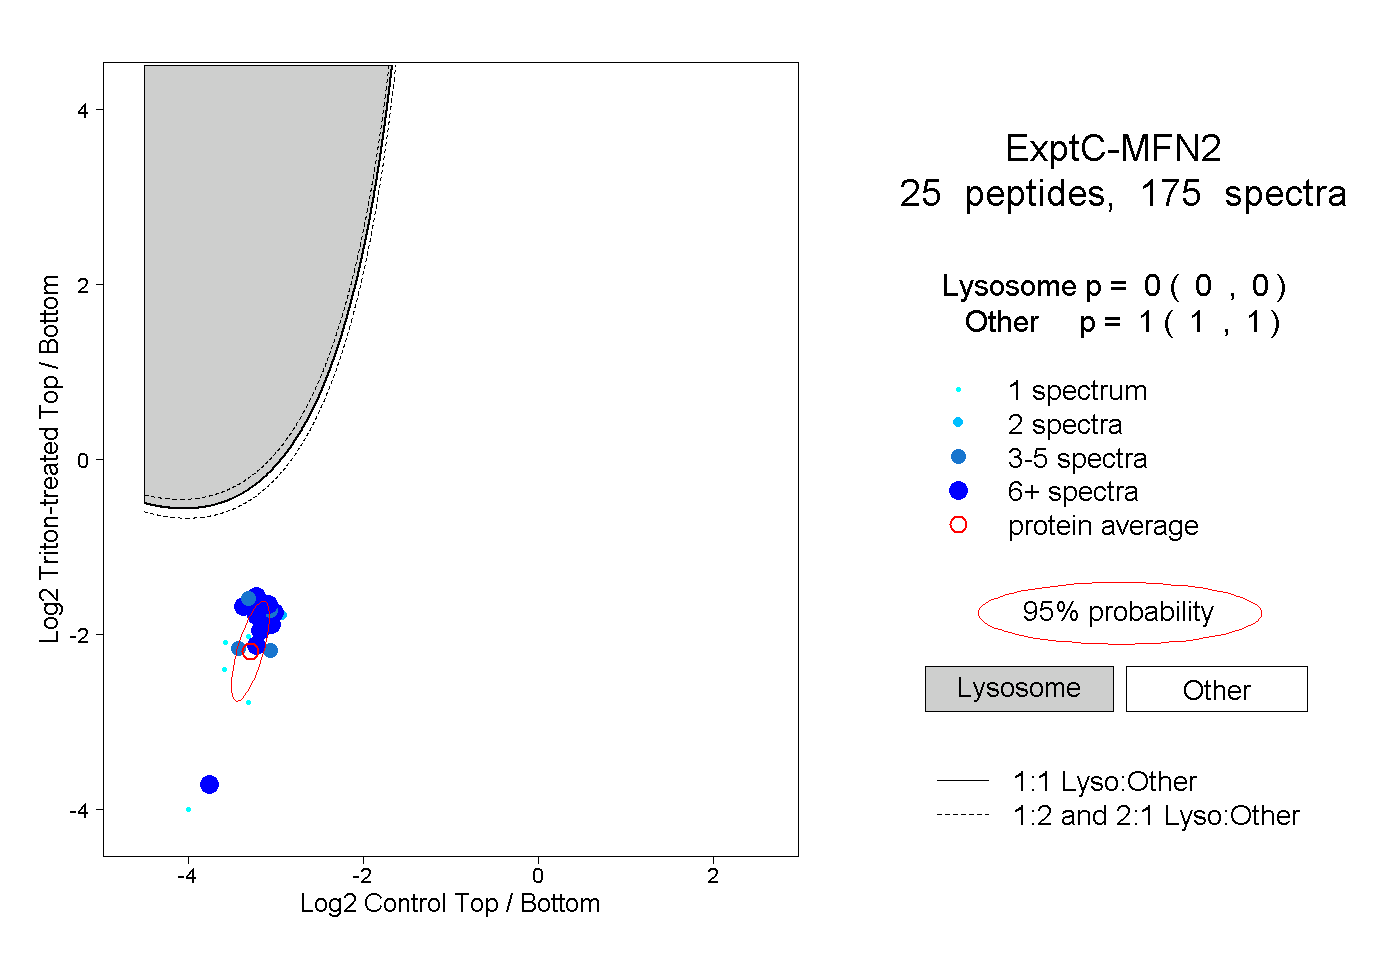 |
0.000 0.000 | 0.000 |
1.000 1.000 | 1.000 |
||||||||
| Plot | Lyso | Other | |||||||||||
| Expt D |
6 peptides |
15 spectra |
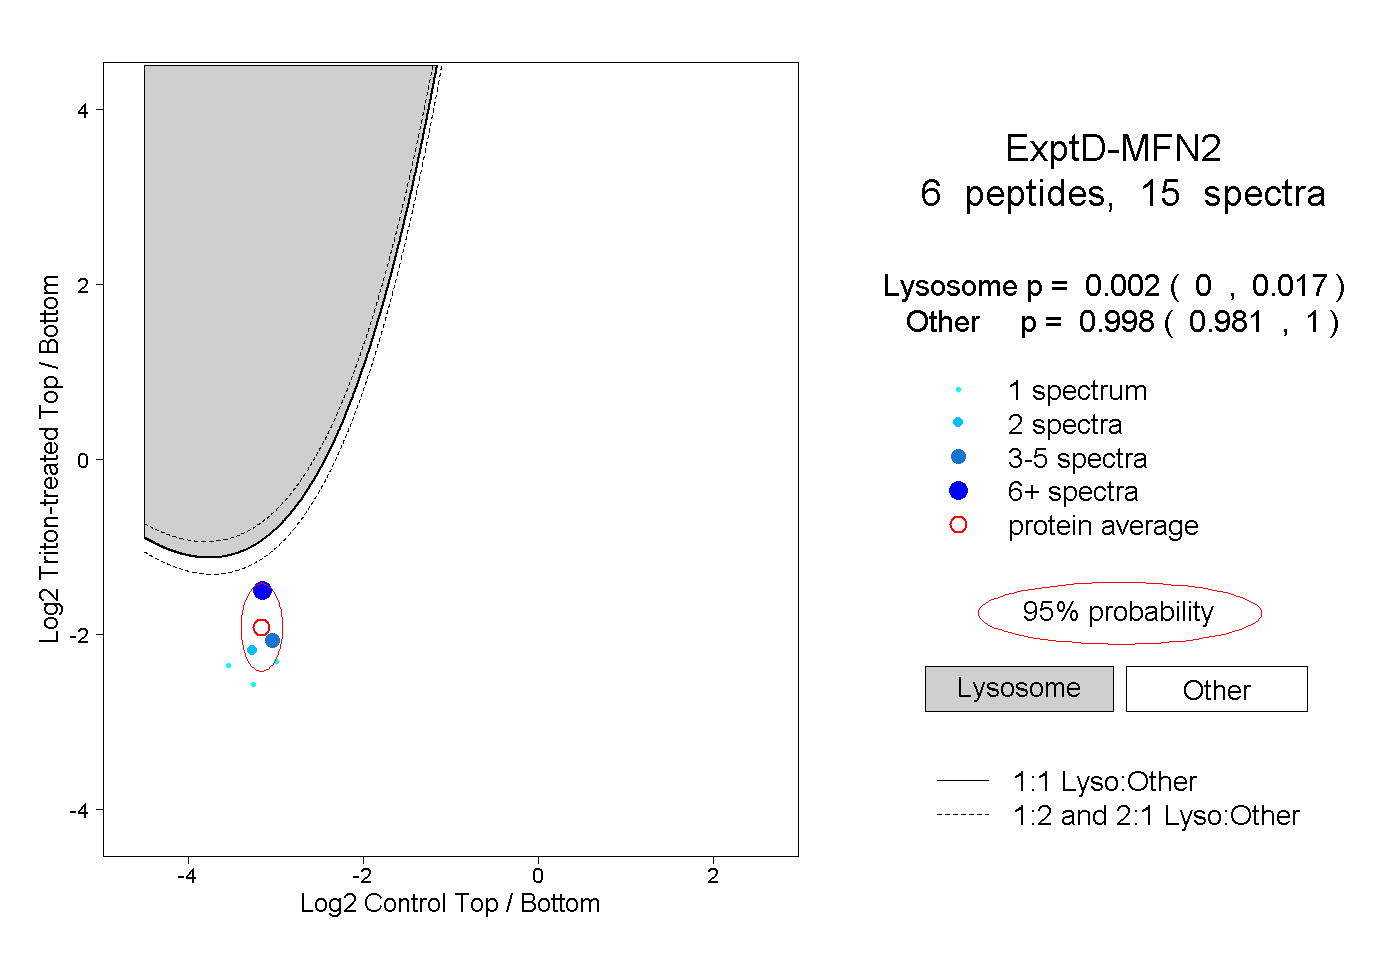 |
0.002 0.000 | 0.017 |
0.998 0.981 | 1.000 |