 13
13peptides
spectra
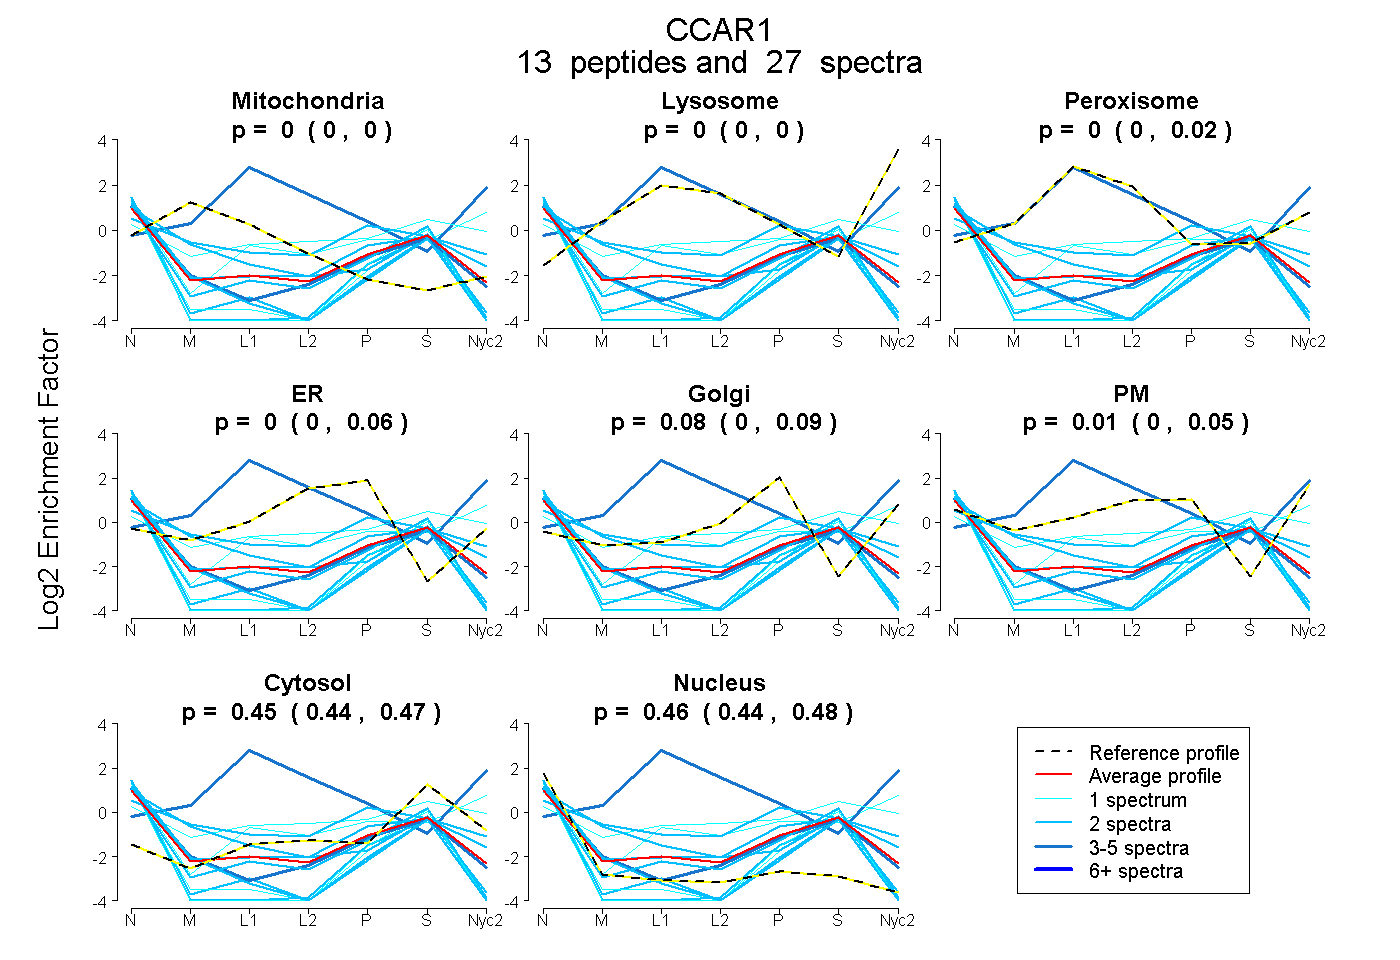
0.000 | 0.000
0.000 | 0.000
0.000 | 0.025
0.000 | 0.065
0.000 | 0.091
0.000 | 0.053
0.435 | 0.465
0.438 | 0.476
2peptides
spectra
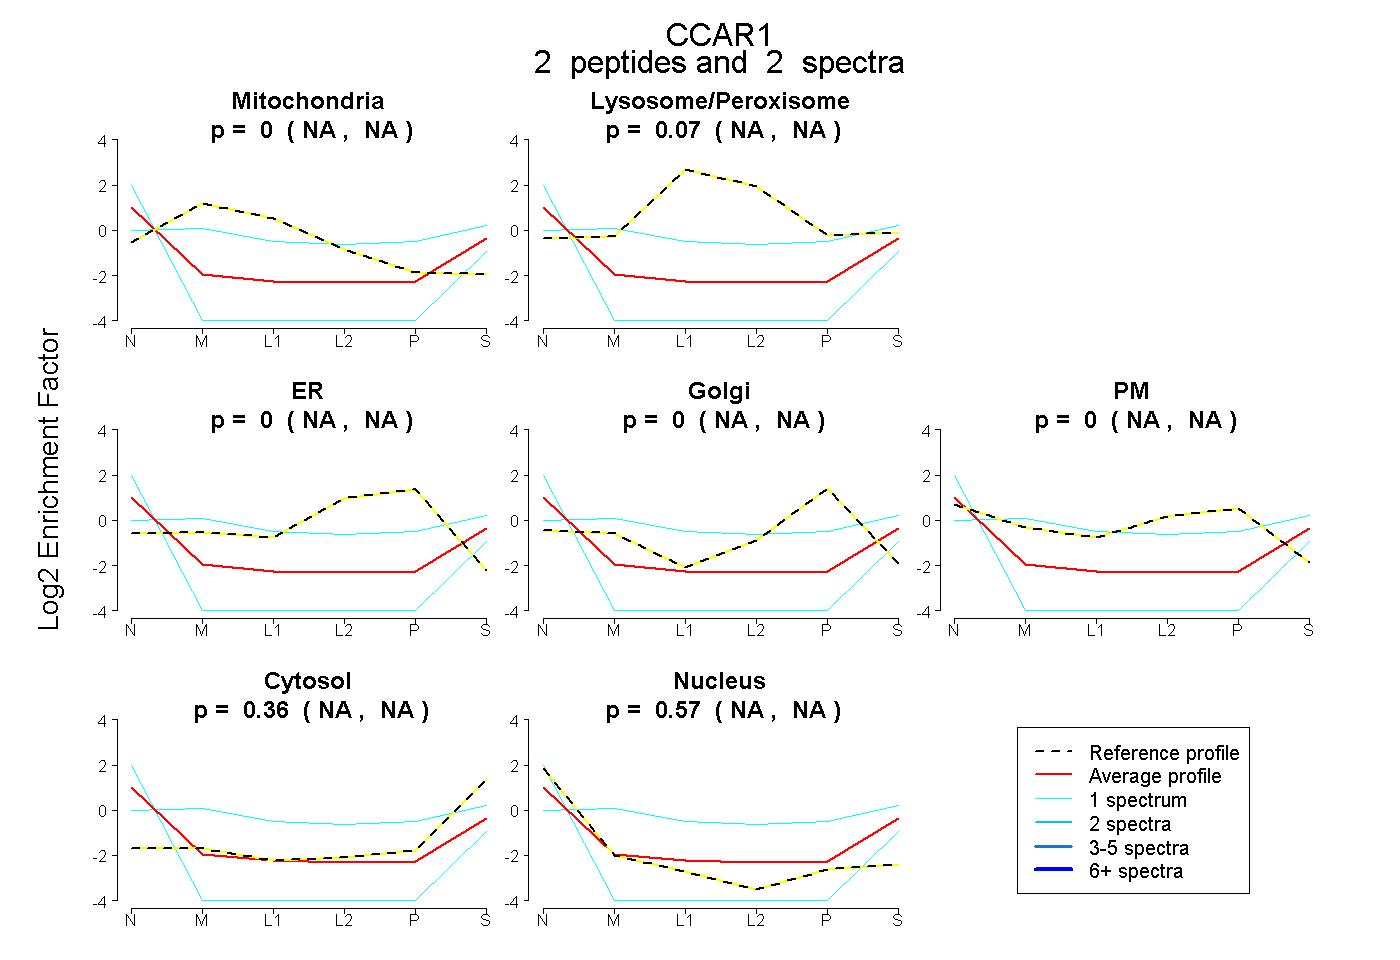
NA | NA
NA | NA
NA | NA
NA | NA
NA | NA
NA | NA
NA | NA
1peptide
spectra
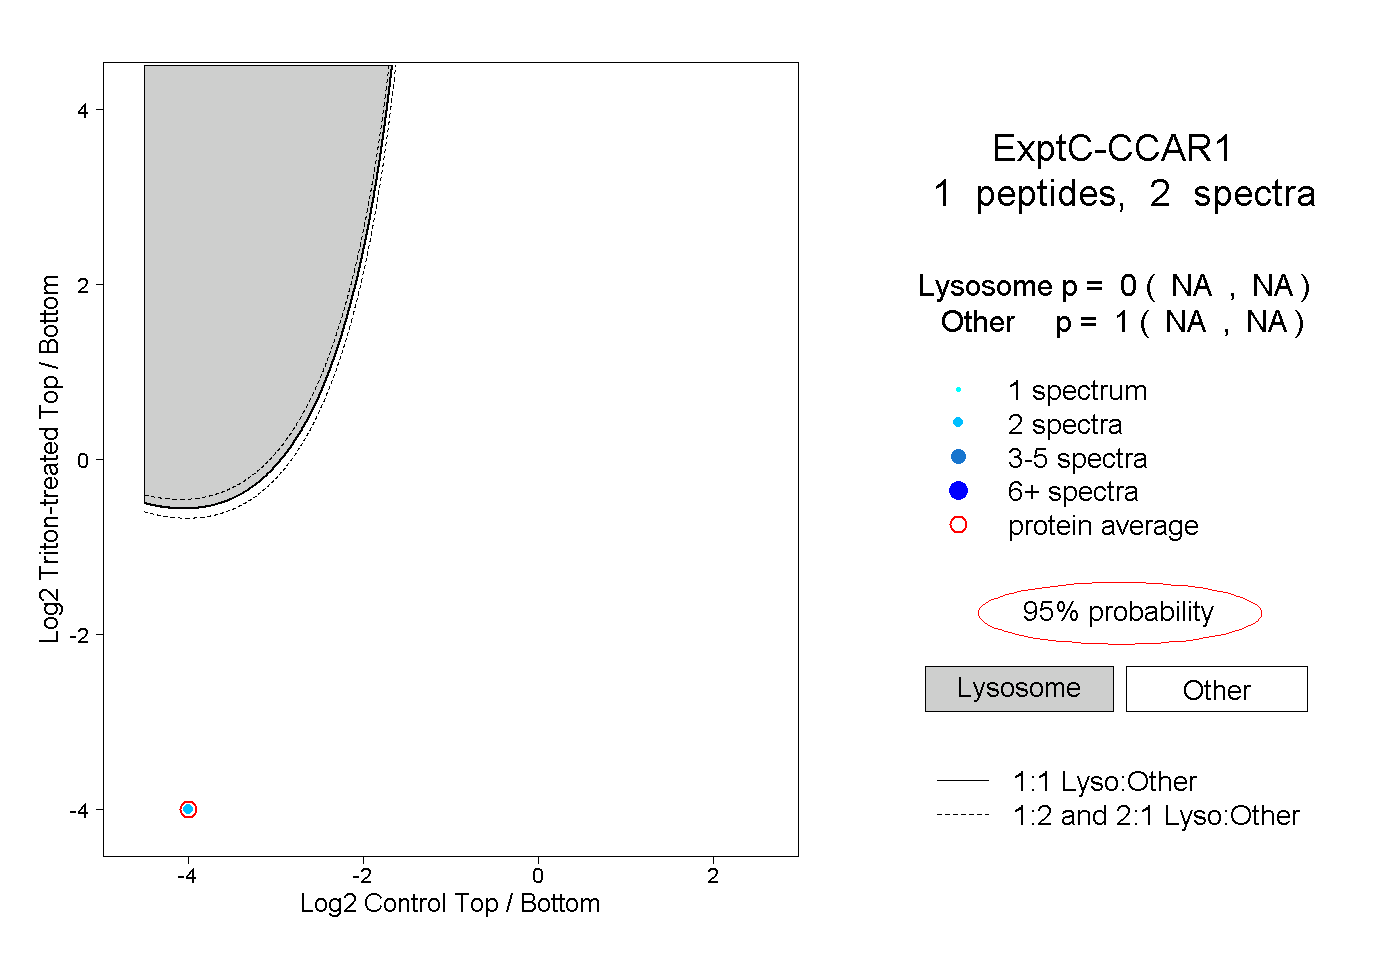
NA | NA
NA | NA