 17
17peptides
spectra
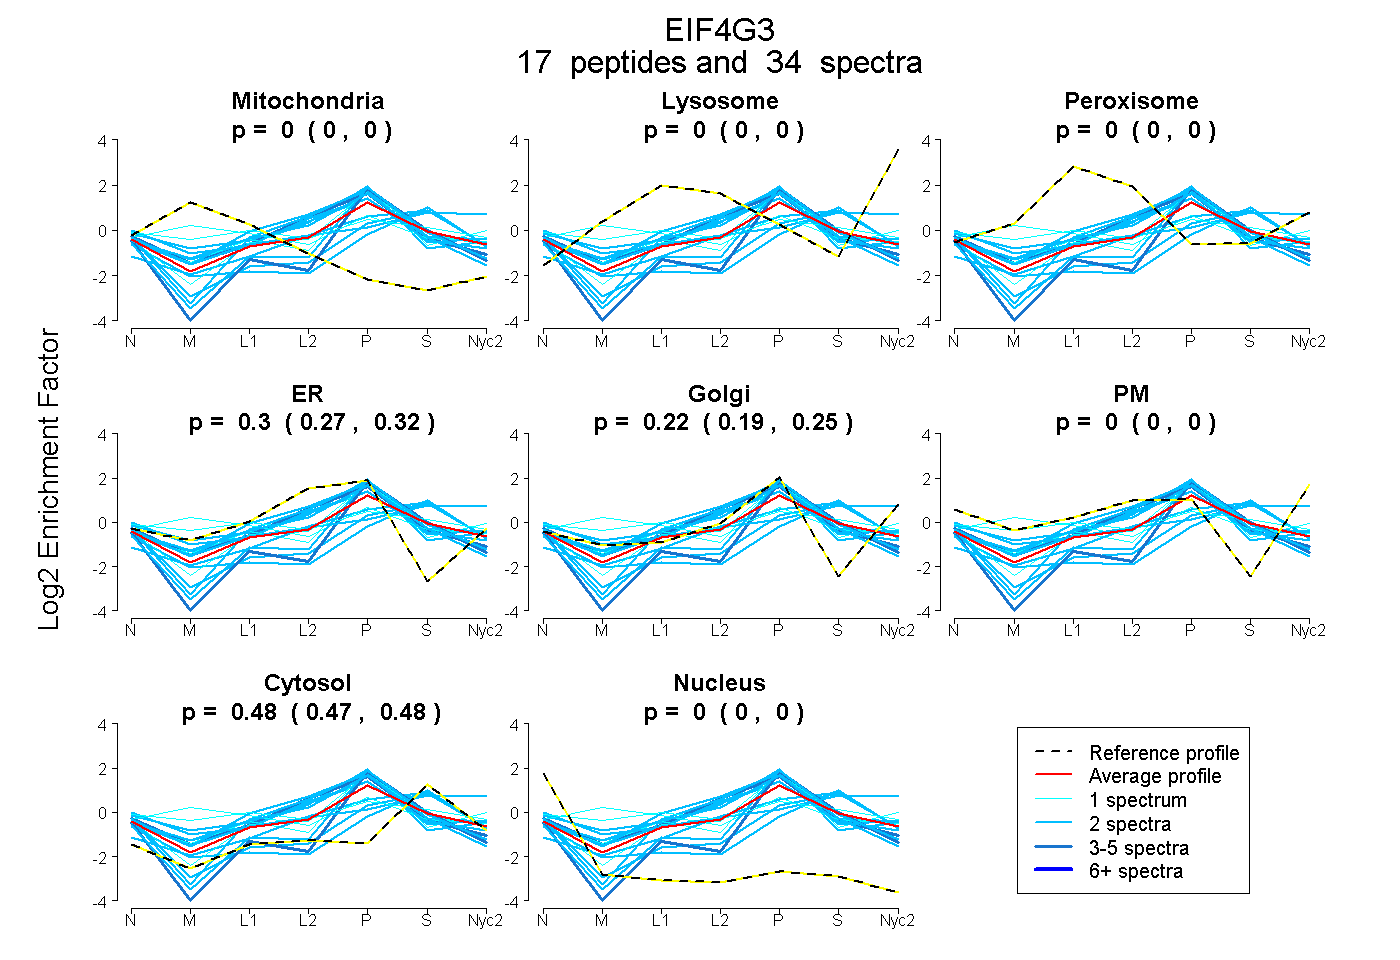
0.000 | 0.000
0.000 | 0.000
0.000 | 0.000
0.273 | 0.323
0.194 | 0.249
0.000 | 0.000
0.466 | 0.484
0.000 | 0.000
5peptides
spectra
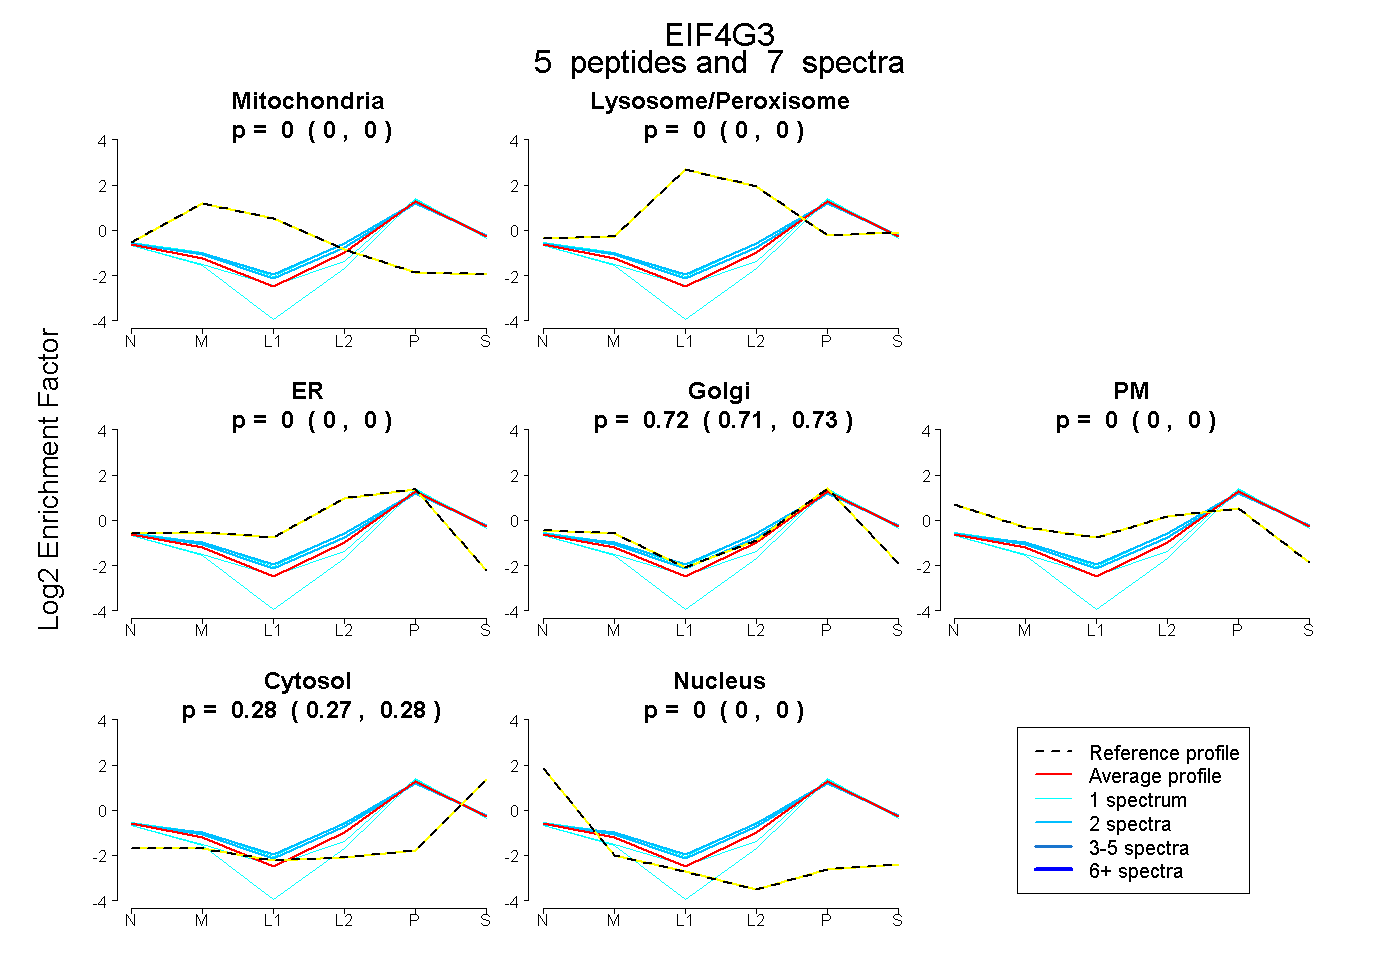
0.000 | 0.000
0.000 | 0.002
0.000 | 0.000
0.710 | 0.731
0.000 | 0.000
0.265 | 0.285
0.000 | 0.000
7peptides
spectra
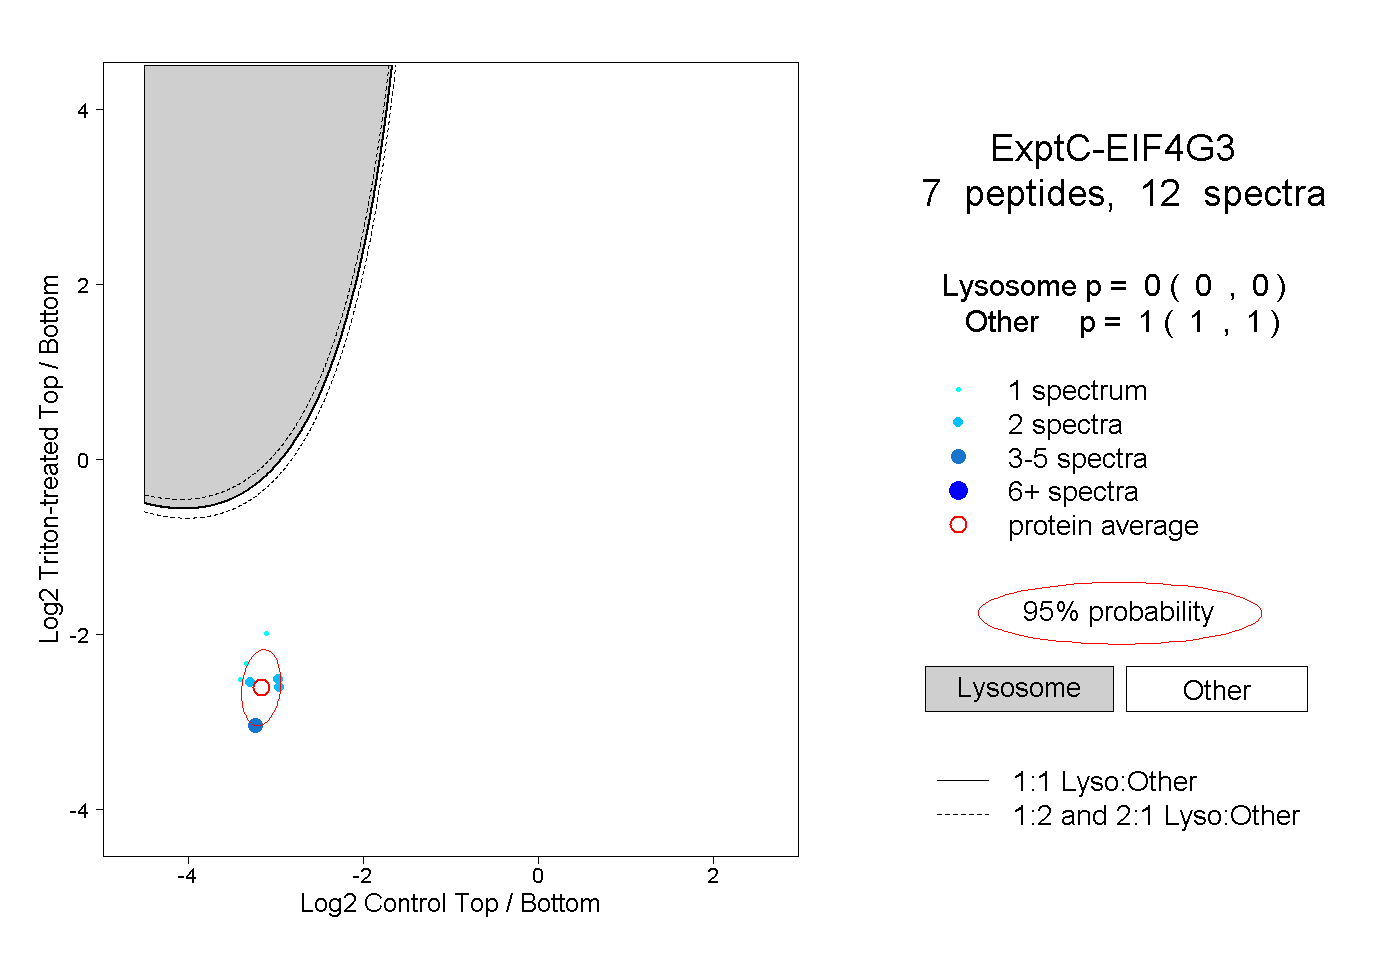
0.000 | 0.000
1.000 | 1.000
1peptide
spectrum
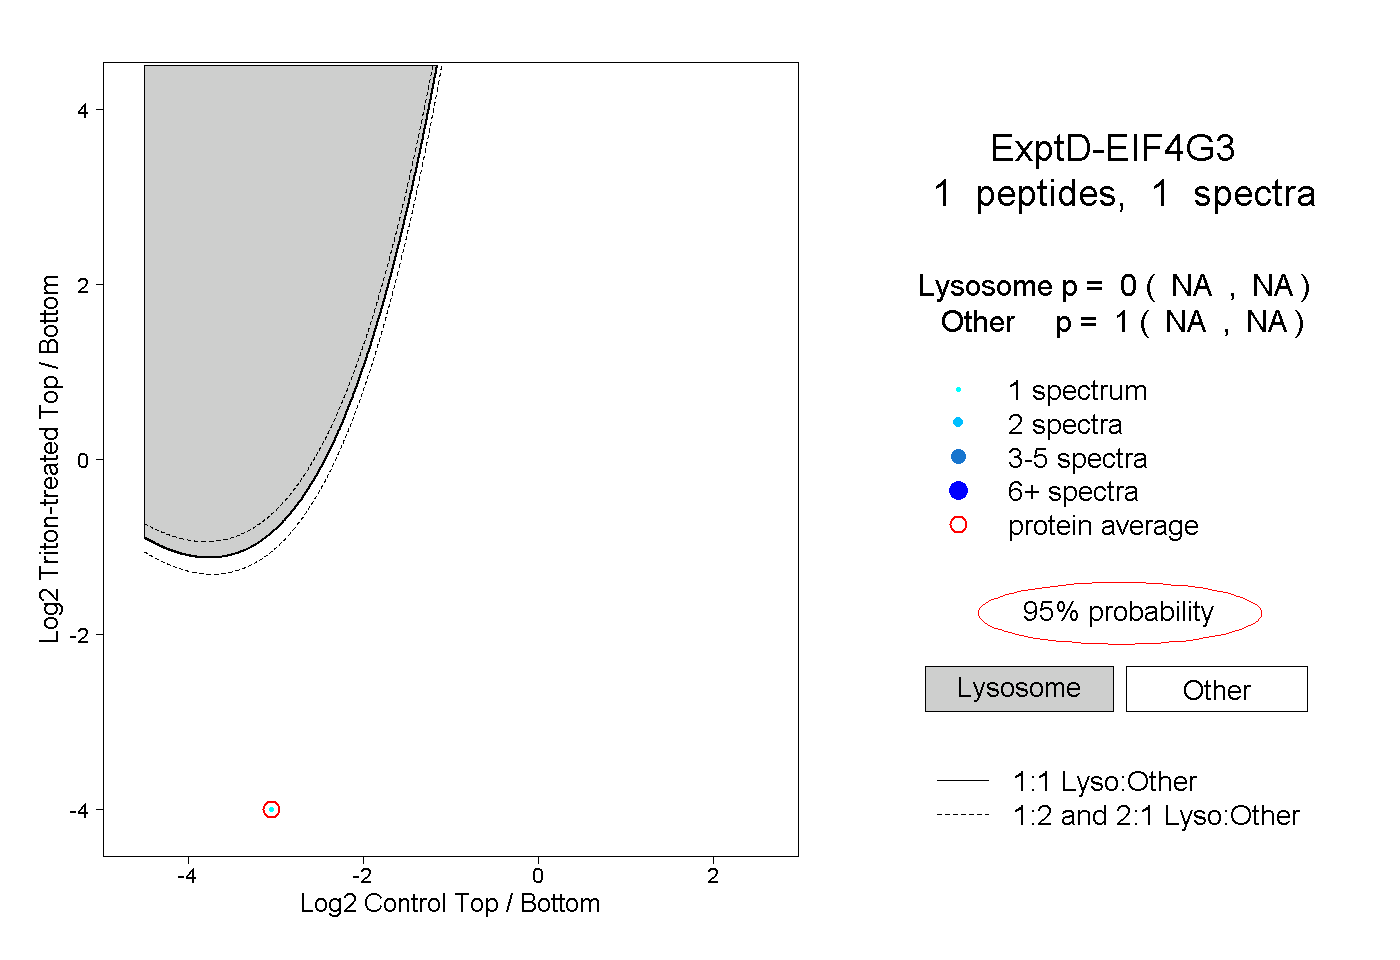
NA | NA
NA | NA