EIF4G3
[ENSRNOP00000059390]
Main page
| | | Plot |
Mito |
Lyso |
|
Perox |
ER |
Golgi |
PM |
Cytosol |
Nucleus |
|
| Expt A |
 17
17
peptides |
34
spectra |
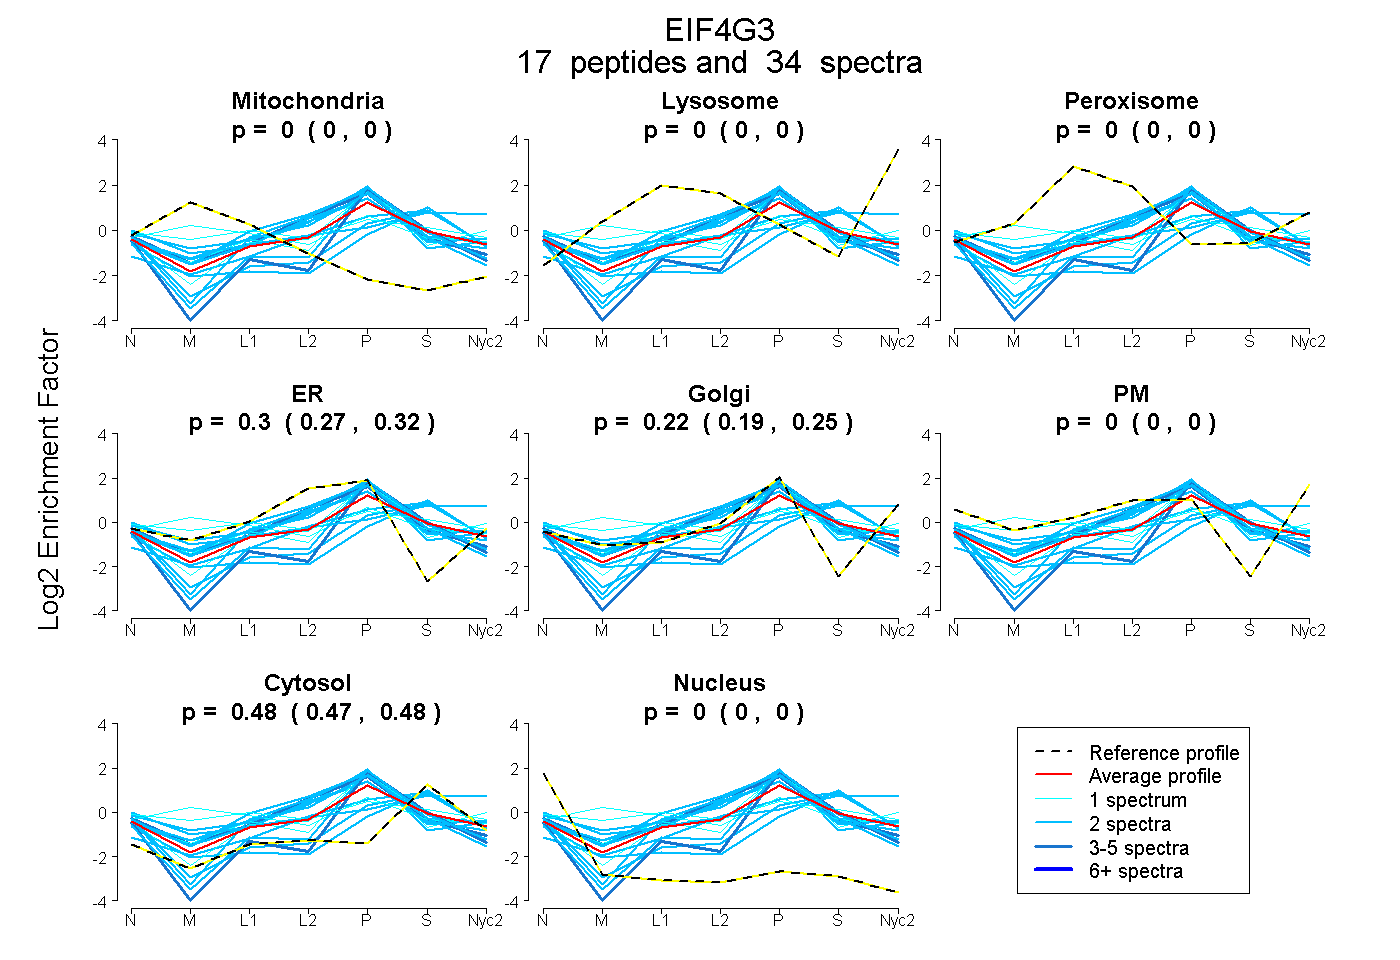 |
0.000
0.000 | 0.000 |
0.000
0.000 | 0.000 |
|
0.000
0.000 | 0.000 |
0.300
0.273 | 0.323 |
0.223
0.194 | 0.249 |
0.000
0.000 | 0.000 |
0.476
0.466 | 0.484 |
0.000
0.000 | 0.000 |
|
| | | Plot |
Mito |
|
Lyso or Perox |
|
ER |
Golgi |
PM |
Cytosol |
Nucleus |
|
| Expt B |
5
peptides |
7
spectra |
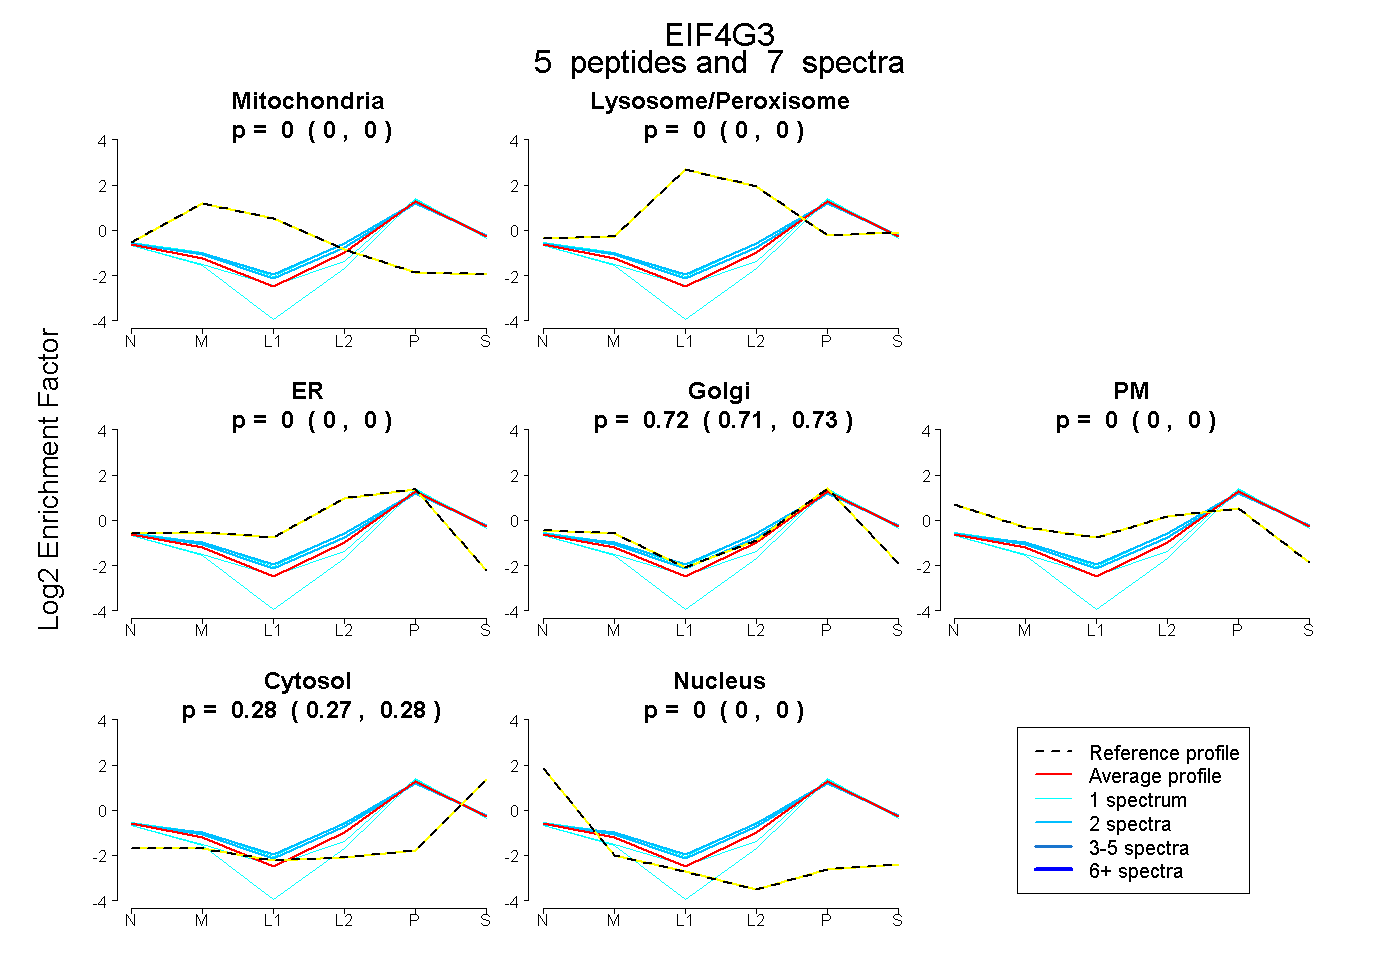 |
0.000
0.000 | 0.000 |
|
0.000
0.000 | 0.002 |
|
0.000
0.000 | 0.000 |
0.724
0.710 | 0.731 |
0.000
0.000 | 0.000 |
0.276
0.265 | 0.285 |
0.000
0.000 | 0.000 |
|
| 2 spectra, TIEQIHK |
0.000 |
|
0.050 |
|
0.000 |
0.694 |
0.000 |
0.256 |
0.000 |
|
| 2 spectra, GVIDLVFEK |
0.000 |
|
0.066 |
|
0.056 |
0.639 |
0.000 |
0.239 |
0.000 |
|
| 1 spectrum, ELEAASAPEER |
0.000 |
|
0.060 |
|
0.050 |
0.649 |
0.000 |
0.241 |
0.000 |
|
| 1 spectrum, VVDEGESLR |
0.000 |
|
0.000 |
|
0.000 |
0.717 |
0.000 |
0.283 |
0.000 |
|
| 1 spectrum, SPAVATVIQR |
0.000 |
|
0.000 |
|
0.000 |
0.671 |
0.000 |
0.329 |
0.000 |
|
| | | Plot |
|
Lyso |
|
|
|
|
|
|
|
Other |
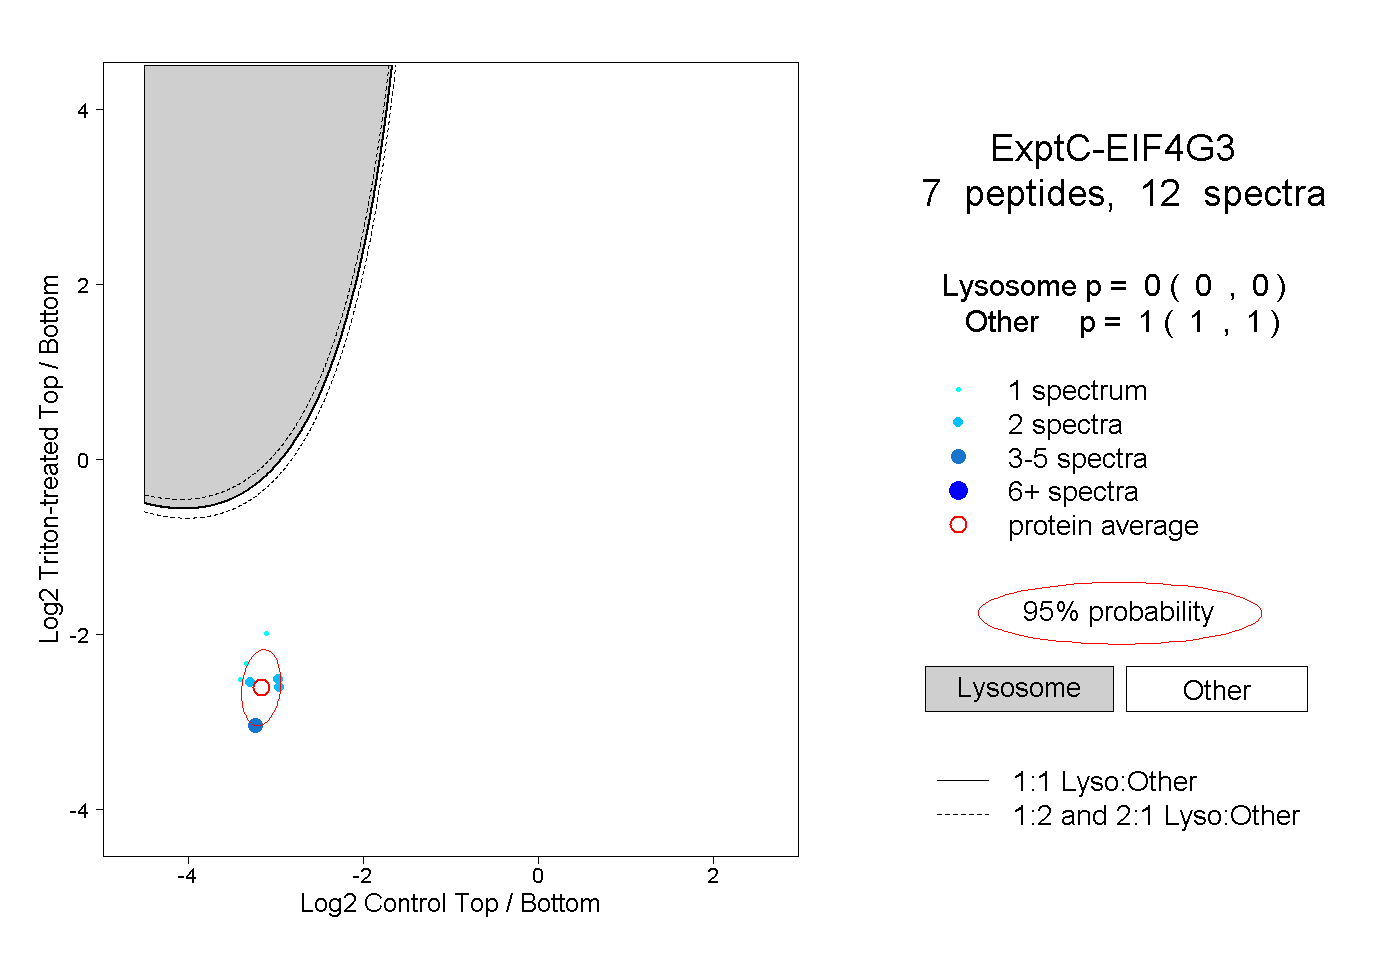
| Expt C |
7
peptides |
12
spectra |
 |
|
0.000
0.000 | 0.000 |
|
|
|
|
|
|
|
1.000
1.000 | 1.000 |
| | | Plot |
|
Lyso |
|
|
|
|
|
|
|
Other |
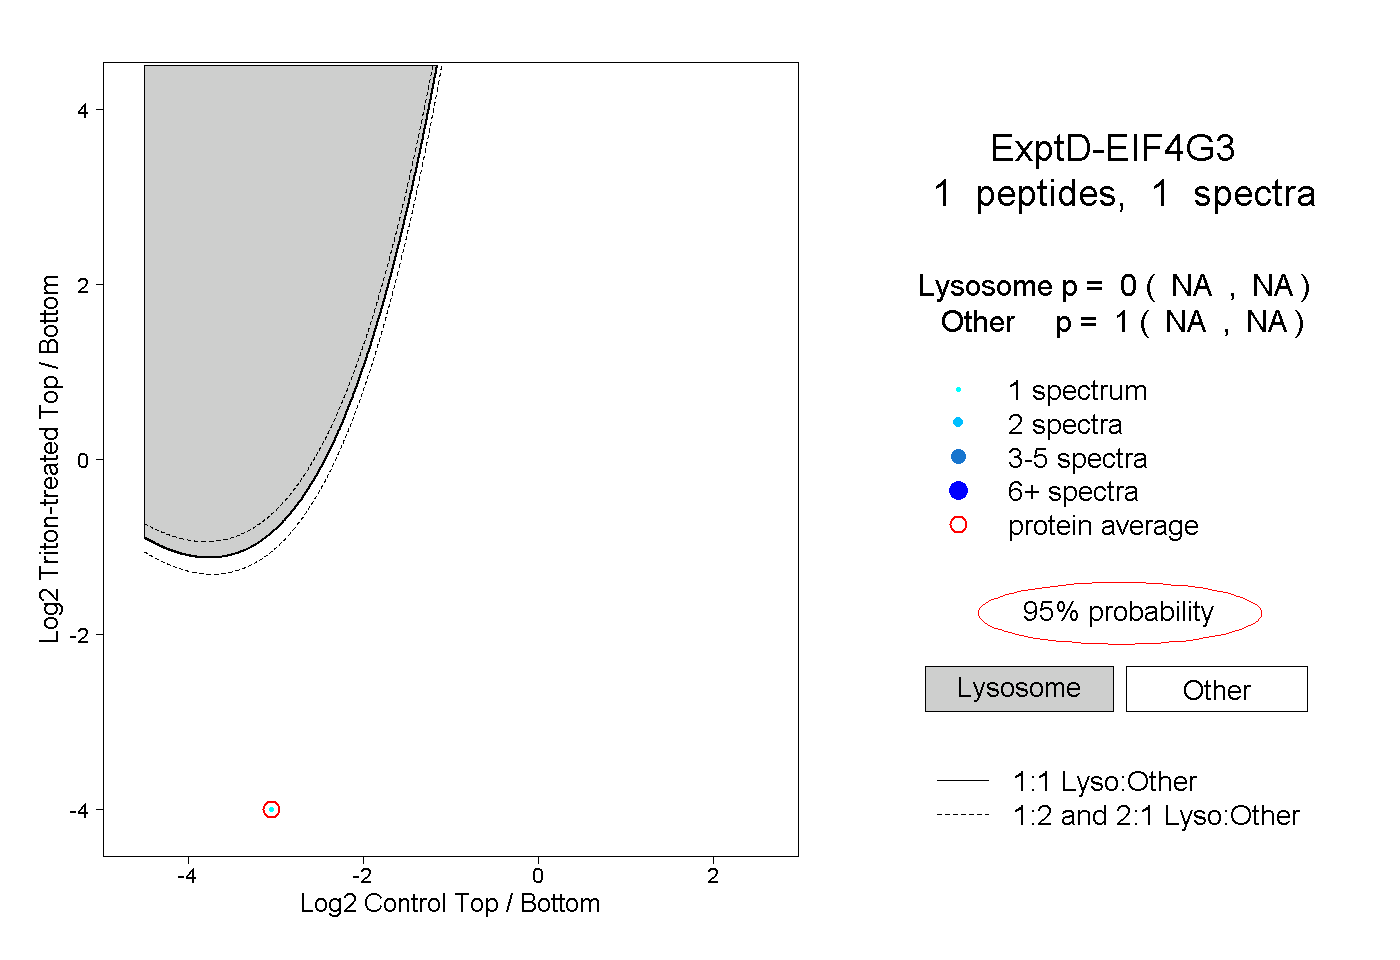
| Expt D |
1
peptide |
1
spectrum |
 |
|
0.000
NA | NA |
|
|
|
|
|
|
|
1.000
NA | NA |