 9
9peptides
spectra
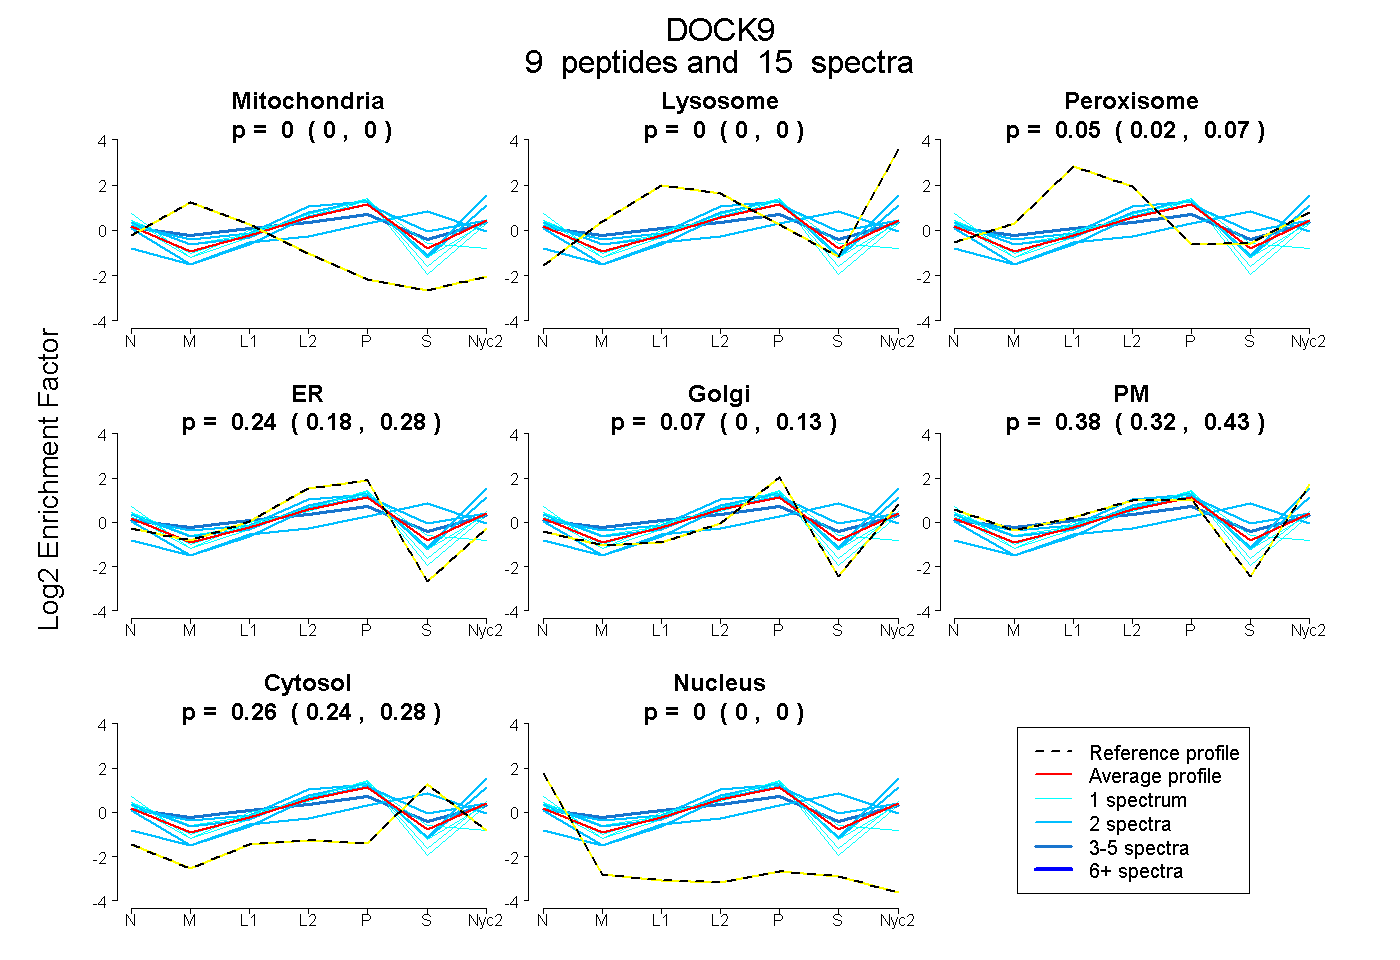
0.000 | 0.000
0.000 | 0.000
0.016 | 0.074
0.176 | 0.285
0.000 | 0.132
0.321 | 0.434
0.238 | 0.277
0.000 | 0.000
1peptide
spectrum
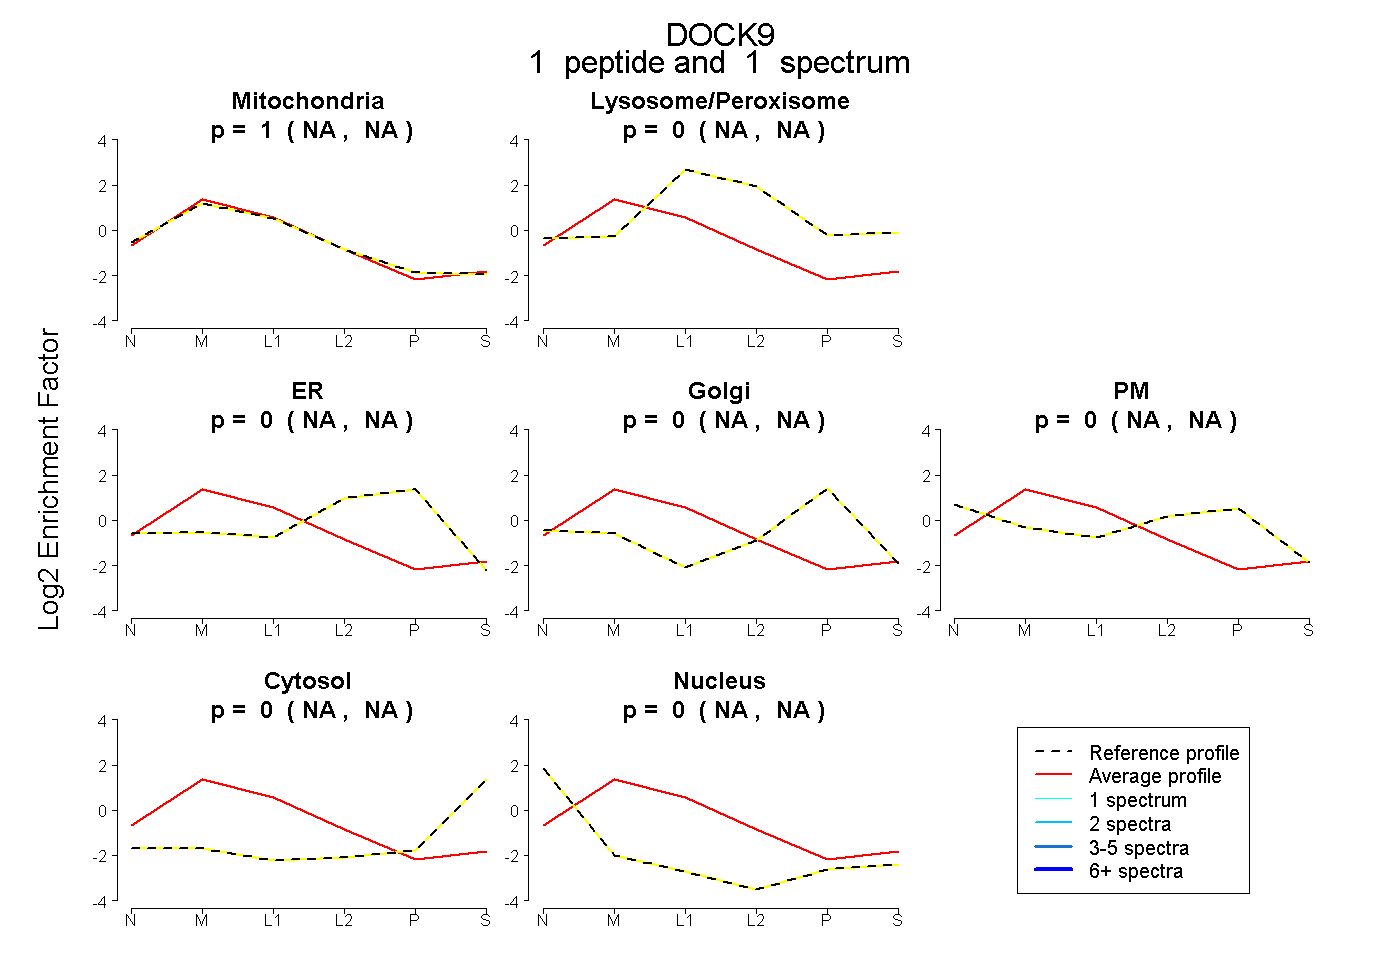
NA | NA
NA | NA
NA | NA
NA | NA
NA | NA
NA | NA
NA | NA
7peptides
spectra
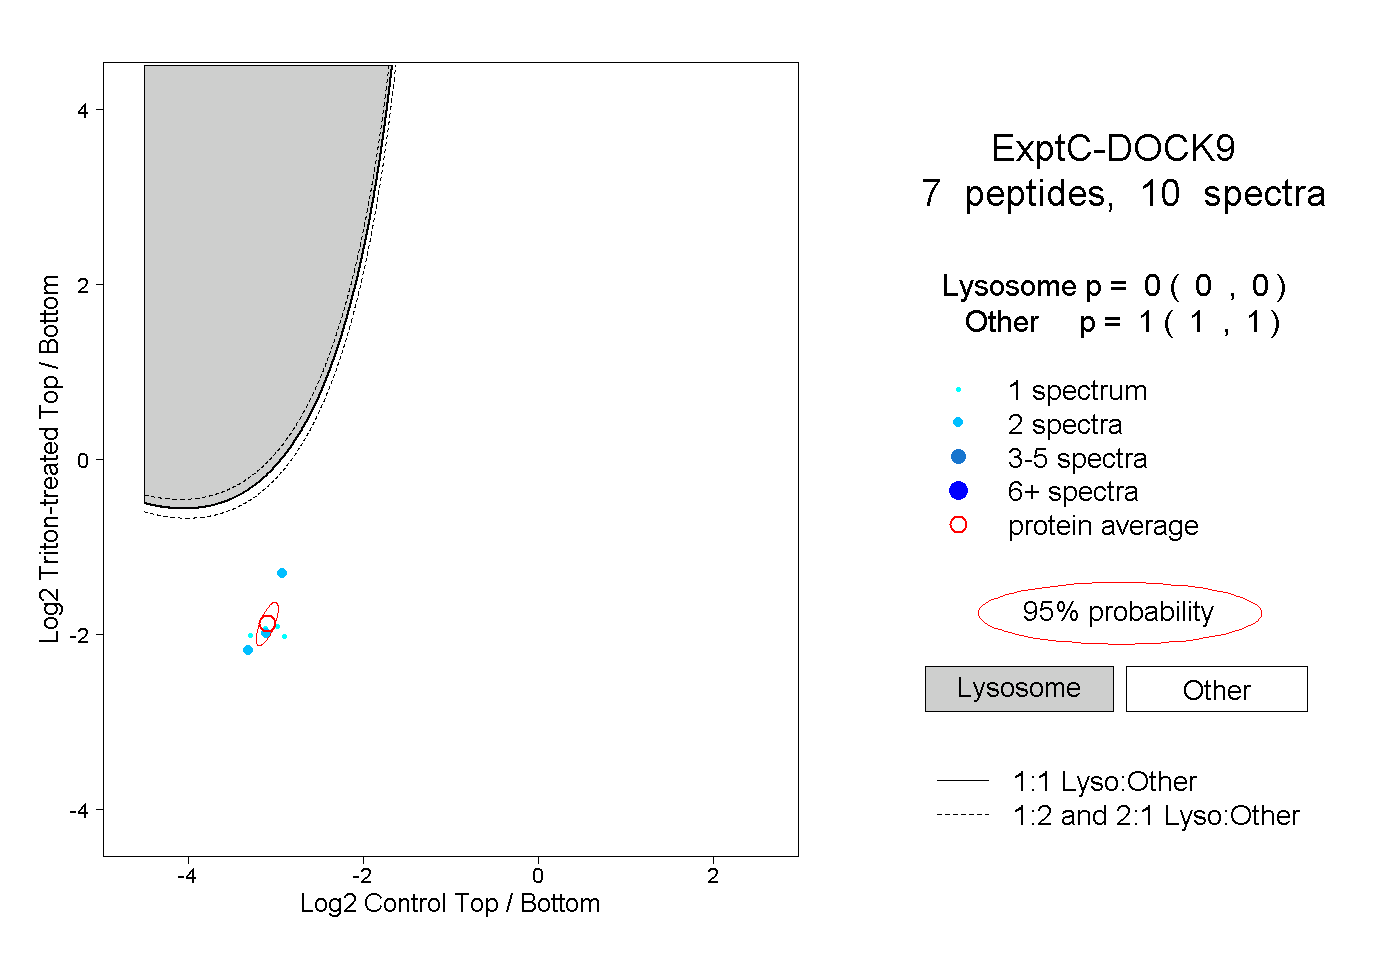
0.000 | 0.000
1.000 | 1.000